Soon, I will be moving the "GIS for Archaeology and CRM" to a new home. I have secured a domain (www.gisarch.com) and I am working on configuring WordPress. Hopefully this move will offer a better site with little inconvenience to the readers. I suppose a few issues will need to be ironed out with RSS and such, but it shouldn't be too painful.
I'll be sure to keep you posted...
Wednesday, May 03, 2006


Monday, May 01, 2006
Bosnian Pyramid: Google Earth Used to Disseminate Data
 Photo Credit: http://www.bosnianpyramid.com/
What are the chances of the world’s tallest man-made pyramid being found in
(This article from Archaeology Magazine will give the stance that many professionals take on this issue)
A little background on this site tells quite an interesting story. The 2,120 ft
In comes Semir "Sam" Osmanagic, a
The website dedicated to the Bosnian Pyramid Archaeological Park, with a clean 3-column design, provides updated content, stories, relevant research aspects (geology, remote sensing, etc…), and a section of maps and KLM downloads ( Sun Pyramid). Fitting well with the Indiana Jones feel to this project, the Google Earth links quickly transport the viewer to the location of the alleged pyramid. Also, there are links to other “pyramids” and a rubbersheeted topo map that gives a decent indication of the topography. How long before someone places a Google SketchUp model on the spot?
Although the technology is nothing fancy and the presentation is simple, the 595 views of the pyramids GE placemark on the keyhole site is probably more looks, virtual or actual, than most archaeology sites will ever see. Certainly, it is the highly controversial and compelling story that created the media frenzy around this “find”, but the availability of data in the form of flying into and around GE placemarks and raster overlays helps get the point across.
Minnesota Historic Plat Maps Online
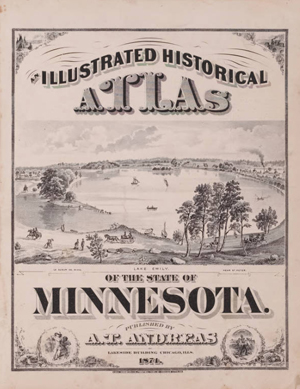
Cover this morning at The Map Room blog, the Minnesota Historical Society has scanned and made available a large collection of historic maps ranging from 1848 to 1907. The online collection is drawn from the society’s archive of 19,000 maps and 2000 atlas volumes. The main archive contains map dating back to 1581.
Thursday, April 27, 2006
Google 3D Warehouse: "A 3D interface to the planet"
That is what Google said about the 3D Warehouse and at this point, I believe them.
The 3D warehouse, as described in the post below, it Google/SketchUps new 3D data housing format and model search portal. As described by Google:
In a days work, I was able to take CAD footprints, photos, and a hand drawn archaeology map and produce a georeferenced, downloadable, and sharable models of insitu archaeological structural components (walls) and detailed surrounding standing structures. I hope my boss does not find out how productive I can be when Google does cool things like this.
Okay, here is a rundown of the online end of the 3D Warehouse. By clicking the "Share Model" icon, a Google window pops up that ties into your own Google account. (What else did you think you were going to do with those 2 gigs for each of the 10 Gmail accounts you have?). Type in a bunch of info about your model, including the Tags, and the upload begins.


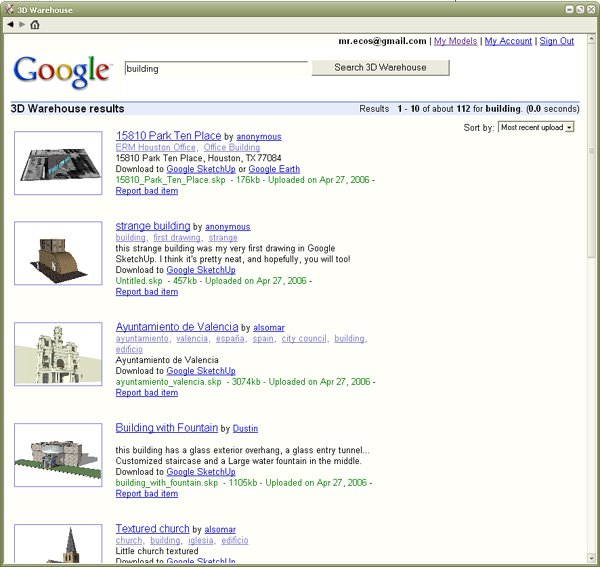
You model is loaded in to your "My Models" page. From here, you can search the tags and filename of others people models. For instance, this is the return from the search for "Building".
When you find a model you like, you can download to either Sketchup or Google Earth. Simple as that.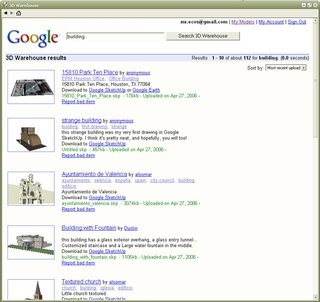
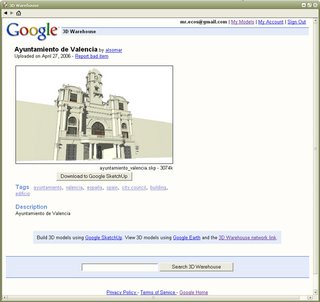
It seems pretty obvious that Google wants a copy of Google Earth and SketchUp installed onto every able bodied computer. They want to see a legion of modelers "SketchIng" their favorite places, tagging them, and sharing them. Content of the world, built by the world, for the world. (or at least the 20% that have access to computers.)
The 3D warehouse, as described in the post below, it Google/SketchUps new 3D data housing format and model search portal. As described by Google:
"Click here to download the 3D Warehouse network link. With this file Geo-referenced SketchUp models in the 3D Warehouse become available for viewing within Google Earth. Virtual world builders, start modeling!"Virtual World Builders... Very cool.
In a days work, I was able to take CAD footprints, photos, and a hand drawn archaeology map and produce a georeferenced, downloadable, and sharable models of insitu archaeological structural components (walls) and detailed surrounding standing structures. I hope my boss does not find out how productive I can be when Google does cool things like this.
Okay, here is a rundown of the online end of the 3D Warehouse. By clicking the
 "Share Model" icon, a Google window pops up that ties into your own Google account. (What else did you think you were going to do with those 2 gigs for each of the 10 Gmail accounts you have?). Type in a bunch of info about your model, including the Tags, and the upload begins.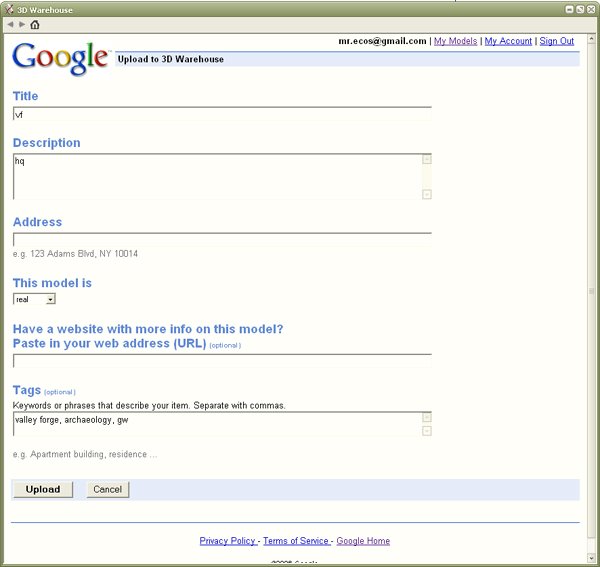
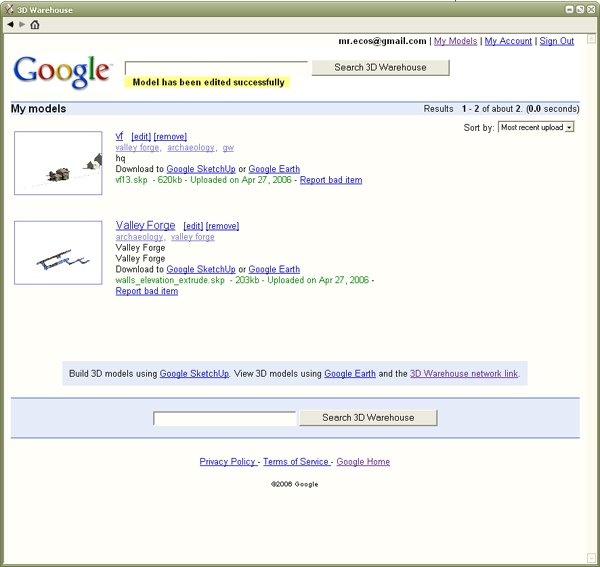
You model is loaded in to your "My Models" page. From here, you can search the tags and filename of others people models. For instance, this is the return from the search for "Building".
When you find a model you like, you can download to either Sketchup or Google Earth. Simple as that.
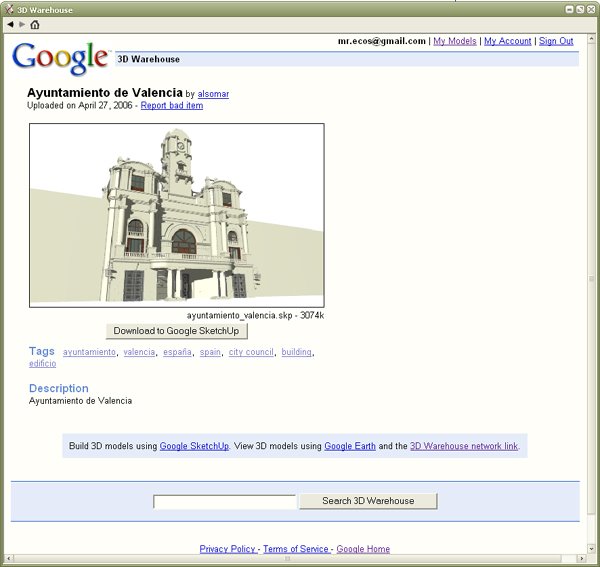
It seems pretty obvious that Google wants a copy of Google Earth and SketchUp installed onto every able bodied computer. They want to see a legion of modelers "SketchIng" their favorite places, tagging them, and sharing them. Content of the world, built by the world, for the world. (or at least the 20% that have access to computers.)
Google SketchUp is now FREE!!!!

Yup, you heard it correctly, the recently acquired @Last team has worked with Google to produce a free version of their very popular 3D architecture and landscape program, SketchUp. (FREE download Here) As of now, SketchUp is the most commonly used program to create 3D models to be placed in Google Earth.
The free Google SketchUp version is windows only. There is also a Pro version which can be purchased for $495. This is much more like the original and at the original SketchUp price.
SO what are the new features!? Well, the Free version appears to have a similar tool selection as the original without some features like realtime shadow modeling and, most noteably, the ability to export in formates other than the Google 3D warehouse. What? Did you say Google 3D warehouse?
Yes, there is a new Kml housing format called a 3D warehouse. Although my download has not completed yet, I have messed with it a little from a link on the ogle earth blog. Save your models to a 3D warehouse and when put on a server, you point people to a 3D warehouse network link, much like a KMZ. When the link is opened in Google Earth, the Places menu will display the locations of the 3D models. Also, on the virtual globe itself, a
 icon appears at the location of the model or a
  icon will appear for an "object collection", a group of models.
The models are not directly downloaded with the 3D warehouse network link. By clicking on a model name/location in the Places menu or clicking on the
icon, a popup window will give you details about the model and ask if you would like to download it.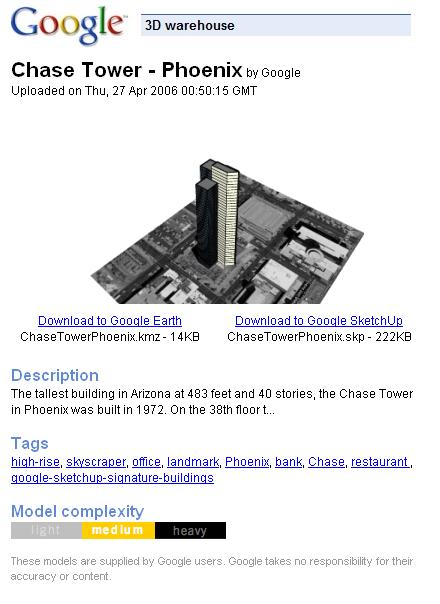
On this popup, details such as model name, size, and complexity are given. Also TAGS!!! Yes, Google has employed tags into the models. Let the Metaverse begin!!!! From here, you may download the model to either Google Earth of Google Sketchup.
At this moment, textures are still not supported in Google Earth. I suspect, as well as many others, that this will change soon.
Here is a list of features the separate the Pro version from the Free version:
 |  | Print and export raster images at higher-than-screen resolution. |
| Access to the following 3D export formats: DWG, DXF, 3DS, OBJ, XSI, VRML and FBX. | |
| Export animations and walkthroughs as MOV (Mac) or AVI (Windows) files. | |
| Use the Sandbox Tools (for organic modeling of terrain, etc) and the Film & Stage Tools (for pre-viz work). | |
| Have access to free email tech support for two years from purchase. |
This story has been scooped this morning on a number of other blogs (Cartography, Google Earth Blog, All Points Blog, ogle Earth). Get out there and make some models!!!!
Wednesday, April 26, 2006
USGS Bedrock Geology Maps for Google Earth
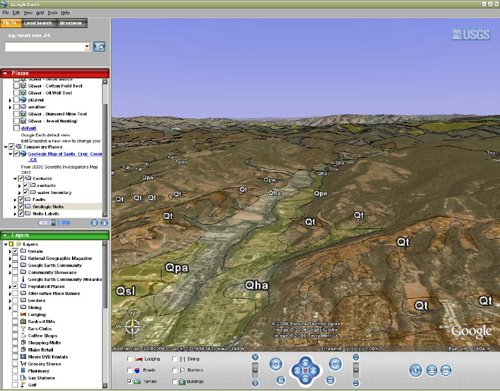
Covered this morning in the Google Earth Blog is the introduction of a series of geologic maps for Northern California in Google Earth KMZ format. Produced and distributed by the United States Geologic Survey (USGS), these maps depict the bedrock geology for 12 counties.
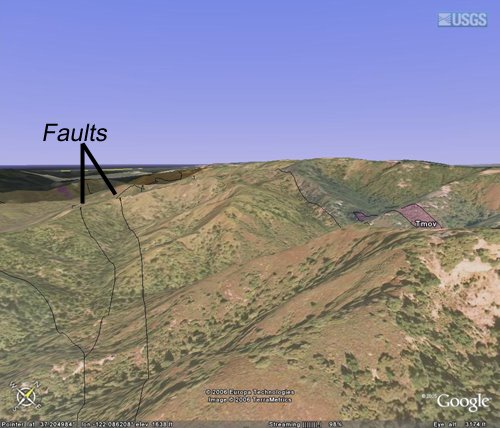
The network link from the USGS includes the geologic units and their abbreviated formation name as a label. Interestingly, the link also includes place markers for faults, in this case all 710 faults in Santa Cruz County, geologic contacts, and water contacts. If course the transparency can be adjusted to merge the geology with the underlying imagery or you can add your own imagery to start some analysis.
Digital bedrock geology maps can sometimes be a pain to find for a study area and unless yours is in North California, this may not help you. But the direction that the USGS is taking here is clear. Data in Google Earth format is very easy to use, free or cheap, readily available, and fun to explore. Given the abilities of Google Earth to add your own imagery and the number of converters that can put GIS and 3D data into Google Earth (KML Home Companion(ArcGIS), Arc2Earth, Maya2GoogleEarth, to name a few) archaeological, Heritage management, and conservation groups should be taking full advantage of this technology. Although the analysis capabilities are simple (ArcGIS Explorer may change this) the data exploration, display, and dissemination aspects are tremendous. With a little bit of conversion and rubber sheeting, specialized information can be deployed to nearly any audience. It seems pretty apparent that with so many people realizing that maps make a fantastic vehicle for all kinds of information, spatial thinking will prevail and the technology will follow.
These maps are in an effort to disseminate geologic information and awareness in light of the 100th anniversary of the 1906 San Francisco Earth Quake.
New RSS feed

After learning that my RSS feed was broken for a long time (thanks Tijl), I implemented a new Feedburner feed. By clicking on the RSS icon
 on the right hand column, you can add my feed to your favorite aggregator. Alternately, if you are using FireFox/Mozilla, you can click on the same icon in the location bar of your browser and add it as a live bookmark.
To anyone who tried to subscribe before, sorry for the inconvenience.
Monday, April 24, 2006
CAA 2006 - Pictures from Closing Party
Here are some pictures from the closing bash of the CAA 2006.
I know this post is long, sorry for the inconvenience. Click on my Flickr badge (under my links) for a few more CAA pictures.
First time to my blog? Please continue past this post and read on about the excellent papers and topics discussed at the CAA.
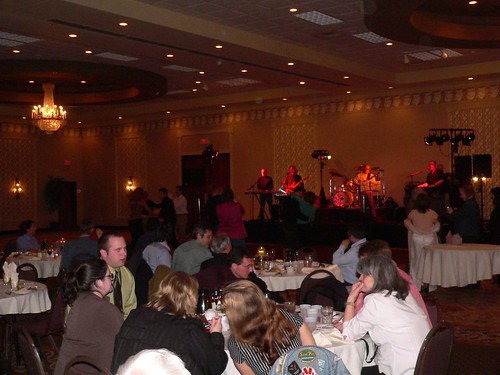
Seated dinner with great band!
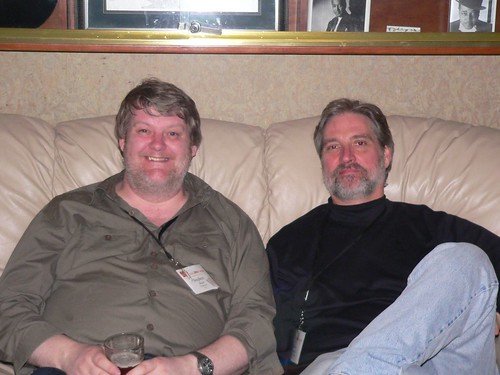
Stephen Stead (CIDOC) and Mark Mudge (CHI)
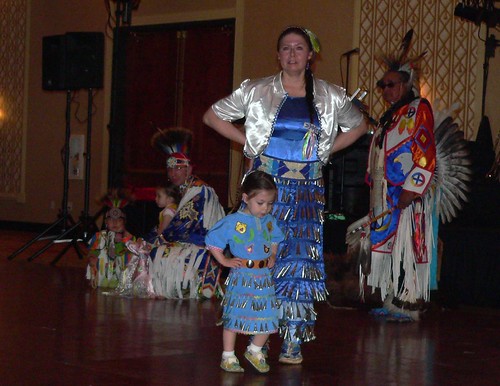
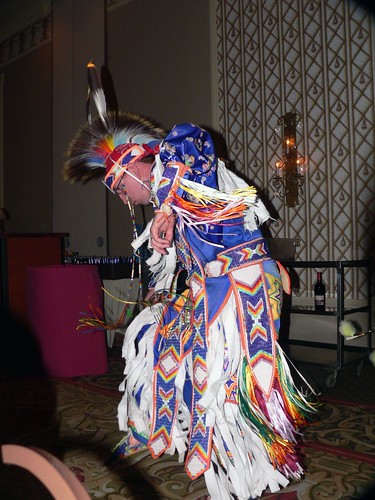
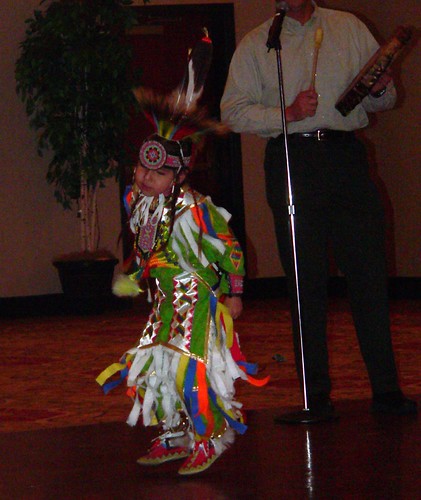
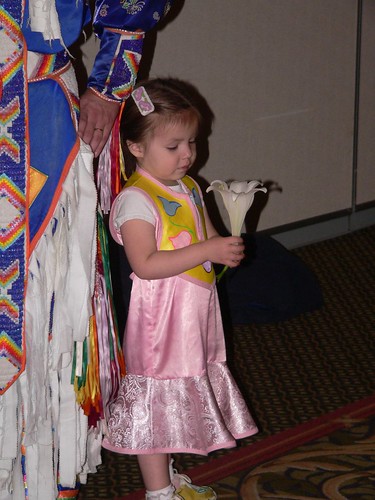
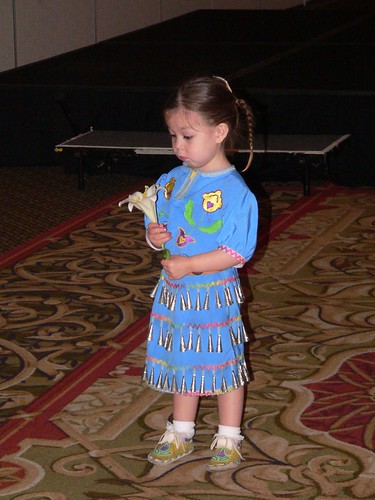
A series of images of the Ojibwa dancers.
I wish I had the names of these folks. They were fantastic to watch and extremely nice and open to talk to. This was a definite high point for the conference.

The esteemed Dr. Frederick A. Cooper and grad student Melissa Geppert.

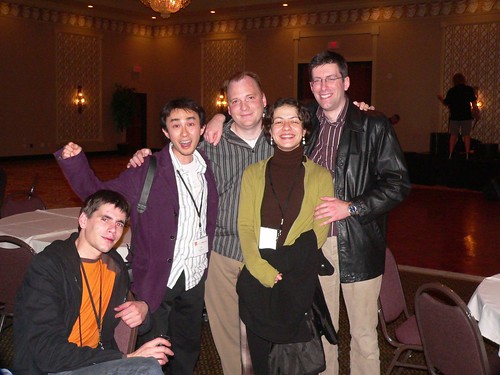
and again, this fun filled cast of characters!
Including Tijl Vereenooghe at the far left.
I know this post is long, sorry for the inconvenience. Click on my Flickr badge (under my links) for a few more CAA pictures.
First time to my blog? Please continue past this post and read on about the excellent papers and topics discussed at the CAA.
Seated dinner with great band!
Stephen Stead (CIDOC) and Mark Mudge (CHI)
A series of images of the Ojibwa dancers.
I wish I had the names of these folks. They were fantastic to watch and extremely nice and open to talk to. This was a definite high point for the conference.
The esteemed Dr. Frederick A. Cooper and grad student Melissa Geppert.
and again, this fun filled cast of characters!
Including Tijl Vereenooghe at the far left.
Sunday, April 23, 2006
CAA 2006 - Day 4: Google Earth, Quantitative Methods, 3D Cityscape

Okay, a little late, but here are my notes from CAA Day 4...
One of the afternoon sessions was full of a number of interesting papers discussing quantitative approaches to classification. As this holds true with any topic related to typology, this session was full of debate and perhaps a little contention.
One of the great papers in this group was on a project by Angela Labrador of the
According to
Angela has created a site (down on April 23rd) where you can follow the progress of this project.
3D City Modeling from Archaeological Data
In another fantastic project by Tijl Vereenooghe of Katholieke Universiteit Leuven in
The last day of the CAA did notdisappointt! The quality of papers was astounding. As with the past posts of the CAA, I apologize for any errors or misconceptions I have published about these papers. If the author of the paper or any other reader pick up on my mistakes, please let me know so that I can correct them. My intention is to reflect the author's intent.
Saturday, April 22, 2006
CAA 2006 - Day 4 and Closing Banquet
Well, the CAA is now over, but the effects are still lingering. Although, I have a bunch of notes from some great papers on Day 4 (Friday), I will not get to them until tomorrow.
Honestly, the closing banquet and fun that followed has put me out of commission. Between the great conversation, great food, great entertainment, and most of all, great people, the CAA 2006 in Fargo ended with a bang! Too bad my head, after a days worth of bumpy air travel, is still reminding me of the fun.
I have a few stories and a bunch of pictures from last evening to share. As soon as I get my sense back, I will have them on the blog.
Honestly, the closing banquet and fun that followed has put me out of commission. Between the great conversation, great food, great entertainment, and most of all, great people, the CAA 2006 in Fargo ended with a bang! Too bad my head, after a days worth of bumpy air travel, is still reminding me of the fun.
I have a few stories and a bunch of pictures from last evening to share. As soon as I get my sense back, I will have them on the blog.
Photo (taken by myself) of a few of the great people
who stuck it out with me until the end.
who stuck it out with me until the end.
Friday, April 21, 2006
CAA 2006 - Day 3 Addendum: ArchaeoML and Tagging
I couldn't quite get all this written last night, so here is a brief of the Day 3 afternoon session I attended...
XML and Tagging
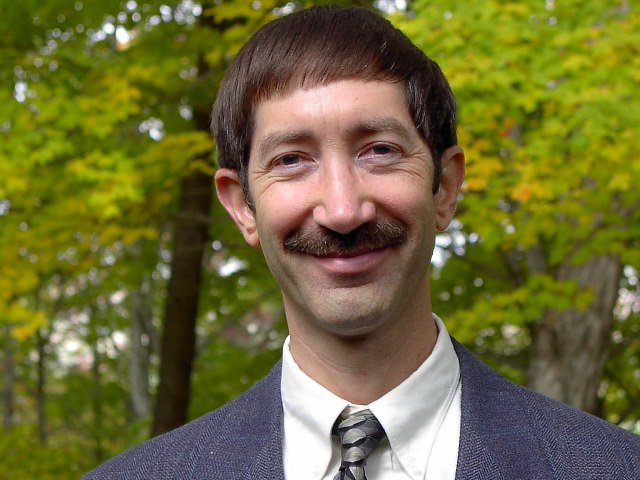
The afternoon session on Database management was chaired by database rock star, Edward A. Fox. Ed Fox is gaining quite a fan club here in Fargo, well, there is at least two of us. If you ever need a real-deal session chair, he's the man!
Back to the session, Tyler Bell, Oxford ArchDigital opened his paper with why XML is like Sex: Everyone thinks they are great at it, Everyone is doing it, everyone is talking about it, but not everyone is as doing what they think they are. This informative talked, in a point counter-point format, followed with what it is to actually "use" XML and why to "use" XML. Although there were no specific applications, Tyler pointed to a number of possibilities and prudent uses for XML in cultural heritage.
Building upon Tyler's XML info, the session turned to a paper by Eric Kansa, delivered by David Schloen. Eric has developed the Open Context project as "an Internet-based archive that aims to preserve and promote our shared, global heritage." Open Context is, in short, a searchable and taggable archive of user provided cultural heritage content. The key to this project is the development of a folksonomy based on the tags provided by the community. Yes, this is the application of "web 2.0" ideas to cultural heritage management! The discussion that followed this paper was quit lively and full of great ideas.
Is a folksonomy the answer to creating a universal language within an discipline that has as many languages as practitioners? Some in the audience agreed that it is a fantastic way to organize data, while others like to view it from the point of adding value and data relationships where specialist have never seen them. The ideas of democratize data and building an archaeological thesaurus based on community tagging was explored. Of course, there are technical problems with relying on tagging as the main system of data description and cross-project mapping. Interestingly, David Schloen, who presented the Open Context paper on Eric's behalf, is involved with a similar project, OCHRE (Online Cultural Heritage Research Environment) at the University of Chicago.
OCHRE is a XML structured schema, called ArchaeoML, with a java web frontend. The general idea between Open Context and OCHRE seems similar, but the underlying data structure is quite different. As I understand it, OCHREs use of ArchaeoML creates a data structure and mapping capability that is much more robust than community tagging alone. The ArchaeoML structure of OCHRE also carries the capability for community tagging and relationship identification. So although, the OCHRE project has many more standards, it still has all the abilities to build a folksonomy based thesaurus and retains the research grade data structure in the XML schema. I hope I did not butcher those descriptions too bad.
Is the internet and/or archaeological community ready for multi-vocal community interpretation and Cultural Heritage with user added value? I think so. It seems that many others feel the same way. How structured should the common vocabulary be? The OCHRE and CIDOC CRM (Stephen Stead, Paveprime Ltd. UK) projects have gone a long way in creating a usable structure that is flexible enough to map varying data sources, but there was also a backing voice to the idea of letting the community develop the language via tagging. I hope that these discussions continue to expand the possibilities for not only how archaeologists interact, manage, archive, and research, but also how the non-specialist public can learn, interpret, and most interesting to me, teach us about the world's cultural heritage.
Thursday, April 20, 2006
CAA 2006 - Day 3: Archaeological predictive Models, XML, Tagging
Another enthralling day in Fargo, ND. There was an abundance of great papers today and plenty of thoughtful discussion to match.
With my chances for a free happy hour drink slipping away, I will just quickly cover some of the highlights.
Inductive vs. Deductive Predictive Models: Battle-Royal!!!
Will inductive models really send earth spiraling to hell in a handbasket? Or are deductive models the way to true enlightenment? Well, this ever present topic was brought up today in a great symposium on Archaeological Predictive Models.
After David Ebert, not to be confused with James Ebert, discussed the "7 deadly sins of inductive modeling", two authors followed with papers, based on opposed theories, that produced very compatible results. Scott Madry of the University of North Carolina, presented a 7 county wide predictive model based on an inductive correlative model. Following this, Thomas Whitley, of Brockington and Associates, presented a deductive based behavioral model for a 2600 square mile (did I record the right?) study area in South Carolina. For my money, this battle of the Carolina's was the pinnacle of the CAA so far. Okay, so no one was throwing chairs, but I sure did scribble some frantic notes.
Basically, the inductive model is criticized by distilling the vast diversity of the environment and archaeology to a series of correlations. Though, the end result is a quantitative, testable, and field verifiable model which fits very well with the requests of the Department of Transportation. Alternatively, the Deductive South Carolina model establishes both environmental and behavioral adaptations which are cross-correlated into a matrix of cost-benefit surfaces. These surfaces are composed into any number of formulas of settlement/subsistence & behavioral adaptations to make testable hypothesis to be modeled. The end result of this approach is a hypothesis testing framework of formulas. This is great for explanatory research, but not great of DOT review. In this case, Whitley combined all 46 testable formulas into a single surface which was encoded with a 1-10 rating of site "possibility"; I'm not really sure what the correct term for that metric would be.
All in all, it was a great demonstration of the application of both methodologies. I truly enjoyed both sides of the theoretical coin. Certainly in the future I will ramble on a bit more about the war waged between inductive and deductive models.
Okay... I would like to include a few words here about the papers on XML and DBs I saw today, but I happened to be out a little too late with a couple of good friends, so it will have to wait. Tomorrow (actually today!) will be the last full day of papers, so it should be exciting!
Wednesday, April 19, 2006
CAA 2006 - Day 2: 3D data capture, Agent Based Modeling, Mobile Applications
Althought blogging etiqutte seems to be a taboo topic, there must be some rule against blogging after a night of free wine and beer. The folks of Fargo have certainly rolled out the red carpet for this conference; it has been a great time so far.
Since the wine flowed like, well, wine... I will have to confine myself to a quick recap of today's events.
3D Data acquisition
3D data acquisition papers covered a few interesting topics. First, Mark Mudge and Carla Schroer at Cultural Heritage Imaging discussed their method of Reflection Transformation Imaging (RTI). This very cool 3D'ish data capture uses a fixed camera taking approximately 16 pictures with individual light sources set up at different coordinate locations. The output is a series of images that are synthesized into a single image where each 2D pixel encodes the 3D data in the form of illumination direction and lighting characteristics (normals). The RTI viewer displays the 2D image, but allows the user to control the location of the light source with the movement of the mouse. In essence, this displays the topography based on the surface normals. This technique works great for small and fragile objects. The team is working on extending the capabilities so that the RTI map can be applied to a passively collected 3D geometry and viewed with adjustable and accurate lighting with a very low file size. Also, the team had developed an open source, Java based viewer.
Secondly, there was a great 3D acquisition project from the folks at the Center for Advanced Spatial Technology (CAST) at the University of Arkansas. Briefly, this team used an optics long range, time of flight laser scanner to perform a High Density Survey of Machu Pichu, Peru and Tiwanaku, Bolivia. Basically, the research group conducted over 225 different scans which included over 150 million points in 13 days (non-consecutive). The resulting point clouds are downloadable, along with a free viewer from polyworks, at www.cast.uark.edu/invirmet
Check it out!
Agent Based Modeling
Agent Based Modeling (ABM) is a topic close to my heart and something I wish to talk about more. Today, I saw few papers on ABM, here is a quick overview of two different approaches. First, Luke Premo, from the University of Arizona, discussed an exploritory ABM for the Plio-Pleistocene of Africa. The intention of Premo's model is not to create a realistic rendition of real world condition (topography, climate, soils, geology). Instead, his intention is to create a simple model to test (falsify) a contemporary hypothesis. The hypothesis is the Central Place Foraging (CPF) model as applied to early Hominids in East Africa. Premo created a model, entitled SHARE (Simulated Hominid Altruism Research Environment), that embeds rules of food consumption and hominid movement based on a patchwork grassland/forest environment. In the end, Premo replicates the general patterns of artifact distribution (called patches and scatters) that are currently attributed to CPF based on the location of the forest patches. At first glance, it seems obvious that the model would produce a patchwork distribution that corresponds to the patchwork of the forest, therefore making dubious results. But this is primarily what Premo is getting at. In the past, this pattern has been attributed soley to CPF as a consequence of modern ethnographic analogy. His simple model shows that CFP is not the only method that can lead to such an artifact distribution. Not that CFP is falsified, but the SHARE model shows that other things may be at work and that modern ethnographic analogs are not the only correlation. Interesting!
On the other side of the coin, John Murphy, also of the University of Arizona, detailed the Dynamic Interface Architecture System (DIAS). This system is a framework for the development of integrative ABM models that share data inputs and actions. The DIAS framework can take models of different systems and link them as modules into a large and more conclusive model. For instance, Murphy discussed the ENKIMDU model (a cultural based model of Mesopotamia) and showed how models of climate, soils, and cow herding behavior, which were create for different reasons, could be plugged in using the DIAS system, to the ENKIMDU model. This framework gives the power to take specialized models, created by experts in that field, and plug them in, seamlessly, to your model. According to Premo, this model would be included in the Emulation class of ABMs.
Mobile Applications
And finally, Claus Dam of the Danish Heritage Agency, Denmark, displayed the cell phone based locative technology they have developed. In short, this system, Nordic Handscape, is broken into two aspects. One part of this project is a system for tourists to retrieve museum data, while the other is for professionals and the public to retrieve data on archaeological sites based on their GPS location or their geocoded address. I do not want to see these projects short, but given the time, I will say that they did everything I could have asked them to do. It knows you location, and it will push you the location, data, and interpretation of archaeological sites within a given radius. The part that I find most appealing about his project is that it has a individual interpretation and data collecting aspect that nears social networking. Each user has their own website with their preferences on which the user can upload photos of sites and tell their own stories about these sites. At the end of the talk, there was a very interesting discussion based on this social aspect. One audience member asked what will happen when we allow lay people to edit out "professional" interpretations of archaeological sites? Other audience members jumped to the defense of the democratization of data and welcomed the wiki'esqu nature of the system. I agree with the wiki folks and would enjoy reading interpretations derived from non-archaeologists. The topic of democratized data has been an undertone.
I would love to delve deeper into the topic of what social networks and massively distributed archaeological interpretations could do for our discipline, but that is another day.
Way past my bedtime... Talk to you all tomorrow.
CAA 2006 - Day2: Morning Poster Session
I had some time this morning to walk around and check out the posters. Here is a quick recap of two interesting topics:
Google Earth, VRML, Native American Pit Houses
Secondly, A University of British Columbia team, composed of Michael Blake, Sue Formosa, Dana Lepofsky, and Dave Schaepe created a poster for a very cool and effective project along the Fraser River in BC. Working with the local native community, the Coast Salish, the UBC team used Surfer 8.0, Global Mapper, Google Earth, and a Cortona VRML viewer to efficiently and inexpensively disseminate archaeological data gathered from a Crast Salish pithouse village, to the interested parties.

The base data for this project is a high density laser transit survey of the site. Brought into Surfer and turned into a DEM, the depressions in the landscape that show the former location of Native American pit houses became very evident. From, Surfer, the DEM is exported to Global Mapper and saved as VRML for web viewing. Alternitvely, the data was also exported as a .jpg and imported into Google Earth, rectified, and exported as a KML. The end result is a highly detailed and realistic depiction of the pit house site which can be geogrpahically explored. This implementaion of geospatial technology is just the types of projects wich we should see more of in the neart future. The technology is cheap, if not free, the technical overhead is low, and the results are easily interpretable in a non-archaeoligcal context and accesible to anyone with a computer. (I realize the last requirement excludes 85% of the worlds population, but hopefully that will change one day.) The UBC team said they are working on a public site to share thier info.

 Iowa Lithic Database
First, is a onteresting project run by the Office of State Archaeologist at the University of Iowa. They have created an electronic database of thier inhouse lithic samples which can be searched to help located the geologic source of your lithic artifacts. In the words of the authors:
"This assemblage is based on macroscopic identification elements including geological references, physical samples, mapped source locations, and a visual basic script program, all combined to form a GIS based system for comprehensive state-wide lithic identification and analysis."Check out thier site for more info and program download...
There should be some great papers presented today. I'll provide an update this evening.
Tuesday, April 18, 2006
CAA 2006 Day 1: Digital Earth and Fladers Archaeology
The first day of the CAA 2006 conference has concluded. Before I head down to the hotel bar to... uh... “network”, I would like to share a bit about two interesting papers I saw today.
The second paper of interest, centering upon the Digital Earth concept, was presented by Karl Grossner of the
Certainly this is a lofty goal, but perhaps an idea that just needs it’s time. With developments in GE, World Wind, and the new capabilities of ArcExplorer, hopefully the buildings blocks of technology will find their place in Grossner’s schema. The technology will develop in that direction, but it will require a user movement to lead to a massively distributed GIS and a few good brains to keep the course steady. As stated by James Boxall [PDF] (2002; 12) “The real issue, in relation to the development of digital earth, is where the librarians will come from in order to help shape the geolibrary component of DE [Digital Earth].”
My synopsis here is limited, so luckily, Grossner revealed that this topic will be soon published as a journal article, but I will have to track him down to find out which.
Each of these papers was presented at symposium devoted to the Electronic Cultural Atlas Initiative (ECAI). The ECAI “uses time and space to enhance understating and preservation of human culture.” Project such as TimeMap and the Silk Road Project are derived from the ECAI. Check them out...
Tomorrow’s agenda includes modeling pathways, 3D data capture, simulation, DBs, and GIS applications.
Monday, April 17, 2006
Computer Applications and Quantitative Methods in Archaeology: CAA 2006
 Here I an in Fargo, North Dakota at the Computer Applications and Quantitative Methods in Archaeology: CAA 2006 conference. Starting tomorrow, there will be 5 days of great presentations and workshops dealing with topics such as, but not limited to, 3D technologies, remote sensing, VR, and database theory as applied to archaeology and cultural heritage. I will try to cover some of the interesting topics I hear during the next few days. Hopefully this hotel internet connection will hold out long enough. Unfortunately, I am unable to upload any photos via FTP or HTTP, but I will do my best to let you know what is going on.
Stay tuned for updates!
Thursday, April 13, 2006
Cartography: Paleogeogrpahic Maps of North America

Blogged at the CCA weblog on Tuesday is a link to a fantastic project undertaken by Dr. Ron Blakey.The maps created by Dr. Blakey represent time slices of the geologic transformations, via plate tectonics, to the core of ancient

The projects website contains 40 of the most representative time slices. From these maps you can witness how the physiography of Laurentia has changed through geologic history. Mountains rise, rifts open, deserts form, and lakes deepen as the earth's tectonic plates subside and become reborn.
Of particular interest to me is the time slice of Late Triassic (210Ma).

Along the Eastern Seaboard of the
In
For the next few million years, the lake shallowed and the mountains eroded. As pressure was release, the Earth thrust magma into near surface chambers and lava outflows. Into the Cretaceous and Tertiary periods of the past 150 million years, the regal mountains which once supplied the Triassic lake with sediment are eroded to reflections of their former selves. The sediments of the
Since I am no geologist, understand that this description may be a bit fictitious, but it is the way I like to see it.
Head on over to the CAA blog to read some more, or to read another rendition of the geologic history of Laurentia, based on these maps, check out the BLDGBLOG.
(Pictures are credited to Dr. Ron Blakey. Fantastic work!)
Tuesday, April 11, 2006
Science Blog: Remote Sensing for Mayan Ruins
From a story recently covered at the Science Blog. Researchers from NASA and the University of New Hampshire in Durham have discovered a number of previously unknown Mayan temple ruins in a densely forested region around San Bartolo, Guatemala. The team employed the use of NASA's Airborne Synthetic Aperture Radar (AIRSAR) to remotely sense the jungle floor. Flown from 8km above the relative topography, AIRSAR's long wavelength allows it to penetrate the jungle canopy and collect data that has escaped other methods.
The research team noticed a "fingerprint" in vegetation growth patterns that indicated the possible presence of a Mayan ruin. On field checking, it was quickly learned that the fingerprint is the result of differential moisture and vegetation growth due to the limestone building materials used by the Mayans.
The remote sensing segment of this project is combined with a detailed climactic study which leads the researchers to conclude that the Mayan civilization may have crumbled due to a series of disruptive climactic events. A better understanding of these cataclysmic processes and their impact on societies will help inform modern nations on how to avoid such pitfalls.
The AIRSAR system was developed in 1988 by the Jet Propulsion laboratory at the California Institute of Technology. The AIRSAR missions covering South America were flown in March 2004. Other archaeological applications of the AIRSAR technology include extensive work at Angkor, Cambodia [also, a great PDF], temples in Nakhorn Ratchasima province, Thailand, 19th century plantations in Georgia, and a study in Tikal, Guatemala to be presented at this years Computer Applications and Quantitative Methods in Archaeology Conference.
The research team noticed a "fingerprint" in vegetation growth patterns that indicated the possible presence of a Mayan ruin. On field checking, it was quickly learned that the fingerprint is the result of differential moisture and vegetation growth due to the limestone building materials used by the Mayans.
The remote sensing segment of this project is combined with a detailed climactic study which leads the researchers to conclude that the Mayan civilization may have crumbled due to a series of disruptive climactic events. A better understanding of these cataclysmic processes and their impact on societies will help inform modern nations on how to avoid such pitfalls.
The AIRSAR system was developed in 1988 by the Jet Propulsion laboratory at the California Institute of Technology. The AIRSAR missions covering South America were flown in March 2004. Other archaeological applications of the AIRSAR technology include extensive work at Angkor, Cambodia [also, a great PDF], temples in Nakhorn Ratchasima province, Thailand, 19th century plantations in Georgia, and a study in Tikal, Guatemala to be presented at this years Computer Applications and Quantitative Methods in Archaeology Conference.
GeoPriv - Geographic Location Privacy Protocol
With location specific information and services becoming widely available, the privacy and restriction of these data becomes very important. GeoPriv is a transfer protocol (in development) aimed at authorizing the delivery of and rendering location specific information.
The basics of this protocol, as I understand it, is an authorization system built from a rule set (policy) which is composed of Conditions, Actions, and Transformations. This policy is stored as an XML document or in a relational database on the location server. The Condition segment of this policy is a set of expressions that are based on certain variables, such as requester identification, server information, and external variables derived from the location itself. These expressions are interpreted as TRUE or FALSE and the Action of PERMIT is granted if the conditions are met. Lastly, the Transformation is an algorithm with defines the resolution at which locational information will be delivered. The transformation combines the union of the permissions to define the requesters level of accuracy. These transformations, as well as the entire policy is intended to be extensible for specific application use.
It appears that the implementation of this protocol could be useful in displaying location sensitive archaeological sites. As I mentioned in a previous post, archaeological site location is highly guarded by both the state government and the archaeologists who investigate them. The fear of looting and disturbance is often cited as the reason for such secrecy. Although, I understand these concerns, I also feel that in a time when archaeologists justify our existence with the preservation of "the Publics'" heritage, we need to loosen our death grip on where sites are so the publics can feel the same senses of place that we do. All rants aside, the GeoPriv protocol, with the use of locational transformations could be a useful tool in disseminating resolution adjusted information on site locations based on conditional rules.
I admit, I only have a general understanding of the specifics of this protocol, so please investigate it a bit (they also have a list-serv) and let me know what you think.
The basics of this protocol, as I understand it, is an authorization system built from a rule set (policy) which is composed of Conditions, Actions, and Transformations. This policy is stored as an XML document or in a relational database on the location server. The Condition segment of this policy is a set of expressions that are based on certain variables, such as requester identification, server information, and external variables derived from the location itself. These expressions are interpreted as TRUE or FALSE and the Action of PERMIT is granted if the conditions are met. Lastly, the Transformation is an algorithm with defines the resolution at which locational information will be delivered. The transformation combines the union of the permissions to define the requesters level of accuracy. These transformations, as well as the entire policy is intended to be extensible for specific application use.
It appears that the implementation of this protocol could be useful in displaying location sensitive archaeological sites. As I mentioned in a previous post, archaeological site location is highly guarded by both the state government and the archaeologists who investigate them. The fear of looting and disturbance is often cited as the reason for such secrecy. Although, I understand these concerns, I also feel that in a time when archaeologists justify our existence with the preservation of "the Publics'" heritage, we need to loosen our death grip on where sites are so the publics can feel the same senses of place that we do. All rants aside, the GeoPriv protocol, with the use of locational transformations could be a useful tool in disseminating resolution adjusted information on site locations based on conditional rules.
I admit, I only have a general understanding of the specifics of this protocol, so please investigate it a bit (they also have a list-serv) and let me know what you think.
Tuesday, April 04, 2006
Robots, Prisoners, Lasers, and 18th Century Grist Mills
Sorry for the delay in posting. I have been in the field recently working on two very cool projects that include lasers, prisoners, robots, and yes, 18th century grist mills. I will write up each of these projects when they stop making me shovel for my paycheck.
Subscribe to:
Posts (Atom)