Thursday, April 27, 2006

Google 3D Warehouse: "A 3D interface to the planet"

That is what Google said about the 3D Warehouse and at this point, I believe them.

The 3D warehouse, as described in the post below, it Google/SketchUps new 3D data housing format and model search portal. As described by Google:
"Click here to download the 3D Warehouse network link. With this file Geo-referenced SketchUp models in the 3D Warehouse become available for viewing within Google Earth. Virtual world builders, start modeling!"
Virtual World Builders... Very cool.
In a days work, I was able to take CAD footprints, photos, and a hand drawn archaeology map and produce a georeferenced, downloadable, and sharable models of insitu archaeological structural components (walls) and detailed surrounding standing structures. I hope my boss does not find out how productive I can be when Google does cool things like this.

Okay, here is a rundown of the online end of the 3D Warehouse. By clicking the "Share Model" icon, a Google window pops up that ties into your own Google account. (What else did you think you were going to do with those 2 gigs for each of the 10 Gmail accounts you have?). Type in a bunch of info about your model, including the Tags, and the upload begins.


You model is loaded in to your "My Models" page. From here, you can search the tags and filename of others people models. For instance, this is the return from the search for "Building".
When you find a model you like, you can download to either Sketchup or Google Earth. Simple as that.

It seems pretty obvious that Google wants a copy of Google Earth and SketchUp installed onto every able bodied computer. They want to see a legion of modelers "SketchIng" their favorite places, tagging them, and sharing them. Content of the world, built by the world, for the world. (or at least the 20% that have access to computers.)

Google SketchUp is now FREE!!!!


Yup, you heard it correctly, the recently acquired @Last team has worked with Google to produce a free version of their very popular 3D architecture and landscape program, SketchUp. (FREE download Here) As of now, SketchUp is the most commonly used program to create 3D models to be placed in Google Earth.

The free Google SketchUp version is windows only. There is also a Pro version which can be purchased for $495. This is much more like the original and at the original SketchUp price.

SO what are the new features!? Well, the Free version appears to have a similar tool selection as the original without some features like realtime shadow modeling and, most noteably, the ability to export in formates other than the Google 3D warehouse. What? Did you say Google 3D warehouse?

Yes, there is a new Kml housing format called a 3D warehouse. Although my download has not completed yet, I have messed with it a little from a link on the ogle earth blog. Save your models to a 3D warehouse and when put on a server, you point people to a 3D warehouse network link, much like a KMZ. When the link is opened in Google Earth, the Places menu will display the locations of the 3D models. Also, on the virtual globe itself, a icon appears at the location of the model or a icon will appear for an "object collection", a group of models.

The models are not directly downloaded with the 3D warehouse network link. By clicking on a model name/location in the Places menu or clicking on the icon, a popup window will give you details about the model and ask if you would like to download it.


On this popup, details such as model name, size, and complexity are given. Also TAGS!!! Yes, Google has employed tags into the models. Let the Metaverse begin!!!! From here, you may download the model to either Google Earth of Google Sketchup.

At this moment, textures are still not supported in Google Earth. I suspect, as well as many others, that this will change soon.

Here is a list of features the separate the Pro version from the Free version:

Print and export raster images at higher-than-screen resolution.
SketchUp Pencil Icon Access to the following 3D export formats: DWG, DXF, 3DS, OBJ, XSI, VRML and FBX.
SketchUp Pencil Icon Export animations and walkthroughs as MOV (Mac) or AVI (Windows) files.
SketchUp Pencil Icon Use the Sandbox Tools (for organic modeling of terrain, etc) and the Film & Stage Tools (for pre-viz work).
SketchUp Pencil Icon Have access to free email tech support for two years from purchase.

This story has been scooped this morning on a number of other blogs (Cartography, Google Earth Blog, All Points Blog, ogle Earth). Get out there and make some models!!!!

Wednesday, April 26, 2006

USGS Bedrock Geology Maps for Google Earth


Covered this morning in the Google Earth Blog is the introduction of a series of geologic maps for Northern California in Google Earth KMZ format. Produced and distributed by the United States Geologic Survey (USGS), these maps depict the bedrock geology for 12 counties.


The network link from the USGS includes the geologic units and their abbreviated formation name as a label. Interestingly, the link also includes place markers for faults, in this case all 710 faults in Santa Cruz County, geologic contacts, and water contacts. If course the transparency can be adjusted to merge the geology with the underlying imagery or you can add your own imagery to start some analysis.


Digital bedrock geology maps can sometimes be a pain to find for a study area and unless yours is in North California, this may not help you. But the direction that the USGS is taking here is clear. Data in Google Earth format is very easy to use, free or cheap, readily available, and fun to explore. Given the abilities of Google Earth to add your own imagery and the number of converters that can put GIS and 3D data into Google Earth (KML Home Companion(ArcGIS), Arc2Earth, Maya2GoogleEarth, to name a few) archaeological, Heritage management, and conservation groups should be taking full advantage of this technology. Although the analysis capabilities are simple (ArcGIS Explorer may change this) the data exploration, display, and dissemination aspects are tremendous. With a little bit of conversion and rubber sheeting, specialized information can be deployed to nearly any audience. It seems pretty apparent that with so many people realizing that maps make a fantastic vehicle for all kinds of information, spatial thinking will prevail and the technology will follow.

These maps are in an effort to disseminate geologic information and awareness in light of the 100th anniversary of the 1906 San Francisco Earth Quake.

New RSS feed


After learning that my RSS feed was broken for a long time (thanks Tijl), I implemented a new Feedburner feed. By clicking on the RSS icon on the right hand column, you can add my feed to your favorite aggregator. Alternately, if you are using FireFox/Mozilla, you can click on the same icon in the location bar of your browser and add it as a live bookmark.

To anyone who tried to subscribe before, sorry for the inconvenience.

Monday, April 24, 2006

CAA 2006 - Pictures from Closing Party

Here are some pictures from the closing bash of the CAA 2006.

I know this post is long, sorry for the inconvenience. Click on my Flickr badge (under my links) for a few more CAA pictures.

First time to my blog? Please continue past this post and read on about the excellent papers and topics discussed at the CAA.

Seated dinner with great band!


Stephen Stead (CIDOC) and Mark Mudge (CHI)


A series of images of the Ojibwa dancers.
I wish I had the names of
these folks. They were fantastic to watch and extremely nice and open to talk to. This was a definite high point for the conference.


The esteemed Dr. Frederick A. Cooper and grad student Melissa Geppert.


and again, this fun filled cast of characters!
Including Tijl Vereenooghe at the far left.


Sunday, April 23, 2006

CAA 2006 - Day 4: Google Earth, Quantitative Methods, 3D Cityscape


Okay, a little late, but here are my notes from CAA Day 4...

On the final day of presentations at the CAA, I drifted around to a variety of sessions and caught a bunch of great papers. Here is a brief summary of the topics I found interesting.

Google Earth for Archaeological Aerial Prospection

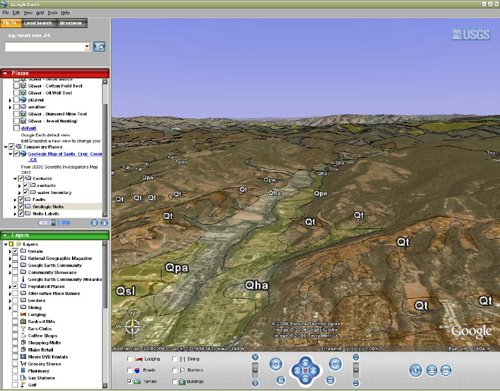
Dr. Scott Madry, of the University of North Carolina, was back with another paper demonstrating an applied and successful technique. Based on Madry's extensive history in aerial survey, he decided to make a project out of Google Earth as a tool for remote sensing. Over the past year, there has been a number of stories of successfully using Google Earth to identify archaeology sites, particularly in Europe. Madry's project is now added to this list.

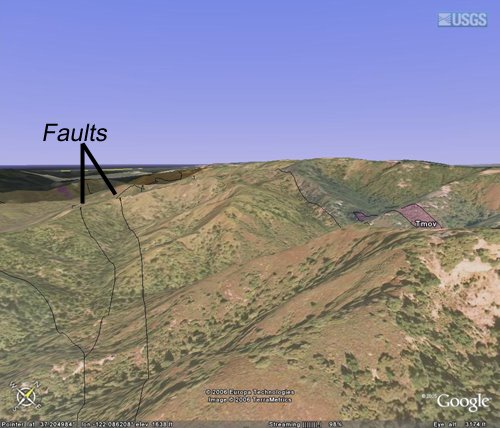
Searching a study area in Burgundy France, which is represented with 1m resolution aerials, Madry set to work. From his office in Chapel Hill, North Carolina, Madry located 3 significant sites within the first thirty minutes. Completely elated, yet surprised with his initial success, he continued through the study area to find a total of 3 major road segments and 101 possible structures represented by circles and squares evident in agricultural fields.

Shortly after his initial remote success, Madry took a trip to the study area with a colleague to field check his results. The field verification proved that through Google Earth, Madry could successfully locate archaeological sites within his study area. The three major sites he initially found turn out to be prerecorded by the local authority, but this only serves as further verification. A large number of additional, unrecorded sites were also discovered. Shortly, I will try to get a few screen shots or KMLs from Dr. Madry to give more detail about his finds.

Quantitative Clustering Method for Pottery Vessel Lots

One of the afternoon sessions was full of a number of interesting papers discussing quantitative approaches to classification. As this holds true with any topic related to typology, this session was full of debate and perhaps a little contention.

One of the great papers in this group was on a project by Angela Labrador of the University of Massachusetts, Amherst. Angela is in the process of devising a technique to automate the extremely laborious task of ceramic attribution and assignment into vessel lots. At the heart of Labrador'’s new tool kit is knowledge discovery methodology that uses Mclust with the free statistics program R to perform a hierarchical clustering analysis on a database of ceramic attributes. This clustering technique also employs Bayesian statistics to help find the optimum clustering level and make the best assignment of the ceramic sherds into the appropriate number of vessel lots.

Labrador'’s intention is to fine-tune her methodology and then create a standalone, open-source application that incorporates a PostgreSQL backend with the Mclust and R routines, all designed in Ruby on Rails. Way cool!

According to Labrador, this application is a product of a larger research agenda to study the influence of typology on our discussion and nomenclature within the archaeology of the Eastern United States. The Lighthouse Cove Site, a Bushkill Phase site in the Hudson Valley of eastern New York, is the basis of her dataset.

Angela has created a site (down on April 23rd) where you can follow the progress of this project.

3D City Modeling from Archaeological Data

In another fantastic project by Tijl Vereenooghe of Katholieke Universiteit Leuven in Belgium, he seeks to bridge the gap from virtual 3D landscape/cityscape construction to archaeologically correct recreations.

Researching the lack of 3D models that accurately portray the less popular domestic areas of well-known archaeological sites, Tijl and his team have developed a way to produce 3D models of entire cities, such as Pompeii and the Mayan city of Xkipche (9km South of Uxmal), based on city plans and socioeconomic maps derived from archaeological excavation. The end result is a model, which can be recreated with adjusted parameters, which displays accurately placed structures built to mimic the interpreted function for that location.

Using a virtual cityscape engine called City Engine System (I do not think this is yet available from the author), Tijl developed a method for substituting archaeological base maps, building footprints, and functional interpretations as the engines inputs. Shape grammars are developed to address how the facades of buildings with different functions should look. The output data from the City Engine System can then be modeled in many of the high-end 3D packages. For this study, Tijl used Maya to produce his results.

Stills and an animated walk through of the Pompeii and Xkipche reconstructions show that Tijl’s methodology is in very good order. The reconstructions looked better than most virtual attempts and serve as a research tool since they are based on archaeological data and can be created in a series of permutations based on adjusting parameter inputs.

Future considerations are the modeling of building interiors, the application of scanned facade maps, avatar populations, and ultimately the ability to produce models from geophysical data.


The last day of the CAA did notdisappointt! The quality of papers was astounding. As with the past posts of the CAA, I apologize for any errors or misconceptions I have published about these papers. If the author of the paper or any other reader pick up on my mistakes, please let me know so that I can correct them. My intention is to reflect the author's intent.
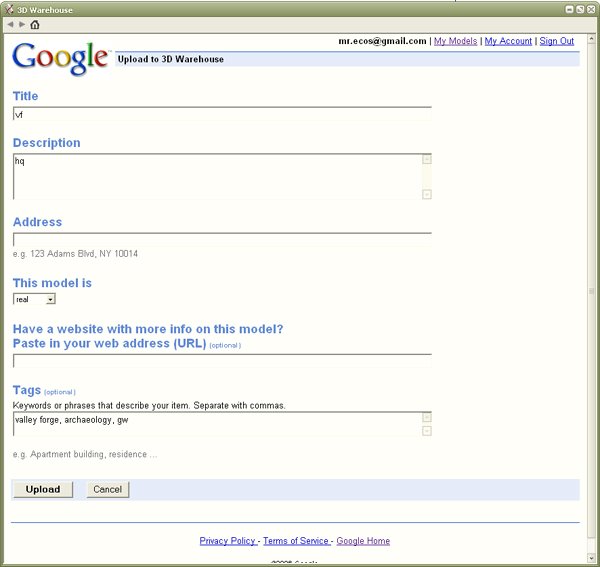
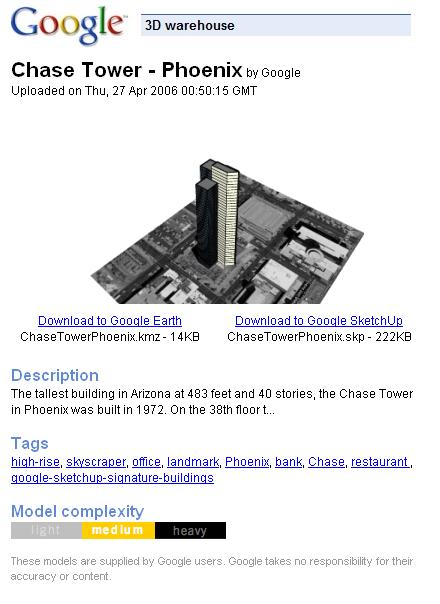