Saturday, March 25, 2006

Google Map of Excavations in Flanders

OpenGraven Be is Google maps based mapping of archaeological excavations in the Flanders region of Belgium (written in Flemish). Below the heading there are links to display sites mapped across Flanders organized by time periods. Each point on the map documents an excavation with a representative photo. Also embedded, is a link to more information regarding that site.

This project represents a first look at what will probably be a pretty common method of deploying archaeological information. One certain advantage is the price and efficiency of using the Google Maps API. Benefiting most from such efforts will most likely be heritage tourism sites. The ability to locate and access information on public excavation and interpretation efforts from an intuitive and common interface will help bring in the people.

A paper [Abstract] on this project is scheduled for presentation by Vereenooghe Tijl (Catholic University Leuvwn, Belgium at the Computer Application and Quantitative Methods (CAA06) April 18th. I will be talking much more about this conference and certain papers throughout the next few weeks. Held for the first time in the United States, the CAA06 is an international showcase for the use of technology in archaeology.

Thursday, March 23, 2006

Export Blender 3D to Google Earth KML

Reported Monday, over at A Life Of Coding, Ynniv released a Python script for Blender 3D that exports your 3D meshes, with diffuse lighting, into Google Earth's KML format. Blender is an open source 3D modeling, rendering, and animation studio that has just celebrated its 10th birthday. This marriage of open source and user created software significantly adds to the body of available tools to create very low cost 3D modeling and visualization.

Check out A Life of Coding for the script and installation insrtuctions.
Below is an image of the example KML provided by Ynniv.

Space monkey over Atlanta

Middle Atlantic Archaeology Conference

Tomorrow morning I will be heading to Virginia Beach, VA for the 36th annual Middle Atlantic archaeological Conference. I will try to get the scoop on any new and cool GIS uses or applications in the Mid Atlantic archaeology/CRM world.

Wednesday, March 22, 2006

Getting your feet wet

Recent fly-over of the Delaware River?

Nope, a new carpet in the Sacramento International Airport. As seen in Boing Boing, pulled from the textile's creator Seyed Alavi's site, this image is of a the airports newly installed carpet. This carpet is woven with the image of the Sacremento River laid along the airport's skybridge. The shaggy green rug in my office just found its new replacement!

Created in a very interesting context of movement, destination, and belonging, Seyed states that his geographical tapestry is also intended for humor. Check out his description of the work.


Visualizing 200 years of utilities in the UK

Much to the appreciation of UK archaeologists, a new program entitled VISTA (Visualizing integrated information on buried assets to reduce streetworks) aims to map the roughly 1.5 million kilometers of gas, sewer, water, and electricity utilities now in place under the their streets. With a significant portion of these conduits being nearly 200 years old, current knowledge of their whereabouts is sketchy at best (diagram below shows the complexity of utilities). Nottingham and Leeds University based researchers are leading a project team, including a number of archaeologists and ex-archaeologists (information gathered from the ARCHCOMP-L listserv), in a test case study at 6 locations within the UK.

This project aims to drastically decrease the number of holes dug to find long lost utilities, increase the response time to fixing utilities, and nullify the reported 30 – 40 injuries per year caused by accidentally digging into electrical lines. Using Ground Penetrating Radar (GPR), Global Positioning Systems (GPS), and pseudolites (essentially ground based GPS satellites) researchers will strive for centimeter accuracy.

The idealized product from this mapping effort is a 3D rendered data set of the entire utility system that can be served to linemen in the field on handheld units. From these handhelds, field crews can visualize the entire network under their feet and avoid costly or dangerous impacts.

Archaeologist in the UK would be very well served by knowing the precise location of such utilities. With the appropriate data in place, archaeologists would not only be safer, but would dig fewer disturbed contexts, and foster analysis through knowledge of construction fill locations and dates which utilities were laid.

Check out this article at BBC news for more info.

Tuesday, March 21, 2006

Spatial Data Standard for Facilities, Infrastructure, and Environment (SDSFIE)

The "Spatial Data Standard for Facilities, Infrastructure, and Environment" (SDSFIE), developed by the CADD/GIS Technology Center, part of the US Department of Defense DoD, is a set of tools to develop "non proprietary" GIS data content standards that can be used with most major off the shelf GIS/CADD and relational database applications. Basically, the SDSFIE is composed of a set of tools that function within a defined data structure to create both spatial and/or tabular data sets which can be specified for a particular application. This data standard is employed by many DoD installations in the US for cultural, environmental, and physical resource management.

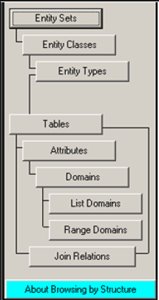
First, take a look at the data structure of the SDSFIE. The hierarchy starts with the "Entity Sets" which houses numerous "Entity Classes", down to "Entity Types", which contain "Attribute Tables", defined by "Domain Tables". To put this in ESRI lingo:

Entity Classes = Feature Data Sets
Entity Types + Attribute Tables = Feature Classes

The SDSFIE comes prebuilt with a host of Entity elements in place. Generally, these are Entity sets, types, and classes that the DoD felt useful in organizing their facilities and structures, but they are not exclusive to the military. There are a total of 26 Entity Sets, 185 Classes, and 1,122 Types as of the most recent SDSFIE release (2.5). The Sets include Buildings, Geology, Ecology, Communications, and Cultural. I will demonstrate an example using the Cultural Entity Set in a moment. From these sets, the classes and types become more specific.


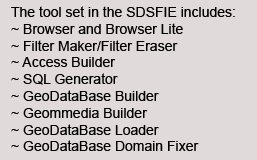
The Browsers are used to browse the data structure to find attributes and relationships. The Filter Maker is used to create a filter of the data structure for fast and efficient database creation. The Builders/Generator are used to create the database, using filters or manually, for a given application. And the Loader is used for data entry. Also handy is the web based Browser and Filter maker. Use this to take a walk through the data structure.


Here is a quick example using archaeology:
Entity Set: cultural
Entity Class: cultural_archaeological
Entity Type: archaeological_artifact_point
Table: crarcart
Discriminant Domain: art_type_d
Domain Values: "Fire_Rock", "General", "Unknown"

The table "crarcart" is used to locate and define "Objects or archaeological significance which, due to their size or nature, have not been removed from the site." In an implementation of the SDSFIE, this table would be used in relation to classes representing archaeological sites, testing areas, sensitive areas, cleared areas, and installations.

Creating filters and GDBs takes a little getting used to, but fortunately, there is a free online "Basic Training" available. This consists of 15 short courses which culminate in a quiz and a printable certificate of completion.

Monday, March 20, 2006

Fun with Google Earth and Archaeology

Over at the Google Earth Community forum, there is an interesting on going competition in the "Fun and Games" board. The "Find the Archaeology" game posts display a Google Earth image of an archaeology site somewhere in the world and it is your job to find it. Play by either searching the boards, or check out the indexed list over at About.com

The most recent archaeological site in question (#22) is: