Saturday, May 13, 2006

Historic Reconstruction with SketchUp

A quick post from a current project. This is a SketchUp interpretation of a historic structure from archaeological field data and historic records. Without going into too much detail, this is a quick image of a reconstructed 19th century paper mill that once stood in front of George Washington’s headquarters in Valley Forge, PA. While Washington was in tenure, the mill works included a Grist Mill and Saw Mill. In the 1840’s the Grist Mill burned and was rebuilt close to the original spot. Then in the 1860’s, the much larger paper mill was constructed, which encompassed the previous structures.The Model of Washington’s Headquarters is accurate to the modern standing reconstruction. Apparently, the building has been remodeled to its historic image at least three times.

Google Maps Link to Area

Google Earth Link to Area (sorry, no models)

Friday, May 12, 2006

Mapchester: Citizen Cartography Mapping Project

After the successful venture of Mass Mapping the Isle of Wight, an movement organized by OpenStreetMap.org, University of Salford, University of Manchester, and Futuresonic plan to create an opensource "wikimap" of Manchester.

"Mapchester will generate a new kind map of Manchester - produced by collective, community effort that will be completely copyright-free."
Aside from creating license free data from this project, Mapchester is also driven by the initiative to get people to participate in their local geography and empower them to take an active role in their 'places'.

This event will be held Saturday 13th and Sunday the 14th of May (This weekend!). Mapchester HQ is on the Lower Ground Floor, 117-119 Portland Street, Manchester M1 6ED, see http://manchesterdda.com/article/12/ or this Google Map
(The space has been generously provided by the Manchester Digital Development Agency and they are also helping in signing people up to take part.)

Here is a link to the online invite.

Site News: www.gisarch.com site down for the moment

If there is anyone trying to reach gisarch.com, I apologize for the inconvenience. Gisarch.com has been down for over 24 hours due to a server change at my hosting service. I think the downtime is unacceptable and plan to switch hosting services in the near future.

Sorry for the delay; I will try to have the site back on it's feet as soon as possible.

Tuesday, May 09, 2006

2nd International Conference on Remote Sensing in Archaeology

From Space to Place

December 4-7, Rome Italy. The 2nd International Conference on Remote Sensing in Archaeology deadline for abstracts is just around the corner (May 30th). Along with the entitled topic of Remote Sensing, the issues covered by this conference run the gamut of technology used in Archaeology. Landscape, environment, ecosystem, image processing, virtual reality, 3D visualization, conservation, geophysics, photogrammetry, open source and Web-GIS are all topics fit for this conference.

“Sense of place is also sense of time, difference between space and place, between ‘global’ and ‘local’. The world process of globalization is removing places and multiplying spaces, reducing the cultural differences. In particular the dissemination of not-places, stations, hypermarkets, hotels, etc. risks to make uniform our perception, reducing what we perceive of the world to a few mental maps. Therefore we want to highlight one the fundamental tasks of remote sensing archaeology, namely, the capacity to use spatial technologies for recovering and identifying places and the sense of place in collaboration with the local communities.”

As described in this text from the conference abstract, the organizers intend to demonstrate how various technologies can be used to bring a sense of place back to archaeological data and interpretation. In my humble opinion, this is a fantastic goal and something that all archaeological technologists should be thinking about.

Being that a snow ball has a better chance in Death Valley than I do of making it to this conference; I hope that the proceedings will be offered online, as is the case with the 3D Imaging and Modeling conference in the previous post.

Monday, May 08, 2006

Online Proceedings from “3D Digital Imaging and Modeling”

Posted by Jeff Thurston at Vector One, here are the full-text [pdf] proceedings from the 2005, Italy-Canada workshop on 3D Digital Imaging and Modeling Applications of Heritage, Industry, Medicine and Land” held in Padova, Italy, May 17th and 18th.

Taking a quick look at the keywords and paper titles, there are no less than 10 references to Cultural Heritage and 5 each for Archaeology and Architecture. There are also a handful of papers discussing 3D techniques with Geomorphology.

Reading back a few posts to my coverage of the CAA conference, there were a few references to the presence of the 3D community at the conference. One observation that struck me is that the all of the companies (~6 to 8 ) in the exhibitor’s hall served some aspect of 3D data collection or visualization. Mostly, these companies focused on 3D laser scanning. Further, the conference CAA program had a symposium on 3D data acquisition. This symposium functioned as a kind of Q&A showcase for the 3D companies.

The strong presence of the commercial 3D laser camp got me thinking. Is there a huge demand from Cultural Heritage and Archaeology that draws in these companies? Companies that are more traditionally focused on mechanical, medial, and industrial applications; projects that generally have bigger budgets that an archaeology dig. Or, do the 3D companies see a fertile ground for broadening their application base? Perhaps the heavy 3D marketing in Cultural Heritage is just the 3D companies getting their foot in the door, something that is plenty common at other industries, but not as much so in Archaeology and Heritage Management.

This is a topic to keep an eye on. If the 3D acquisition technology continues to become more affordable, or CR project’s budgets make room for these technologies, it is certainly something of use. The industry behind it has a good history and is full of really smart and innovative people.

Coincidently, I am working on a project this week that involves 3D laser scanned data and archaeology. This is my first project that integrates 3D laser data, archaeological field data, traditional GIS data, and interpretative visualization. There have been some bumpy paths leading to the coherent integration of all these data sets. When finished I plan to share some of the results.

Point cloud image from: http://www.lupos3d.de/


Friday, May 05, 2006

Comparing NASA to Archaeology?

"He [Burt Rutan] likened NASA’s efforts to archeology.”

- author Leonard Spitzer, Space.com

How exactly do you compare NASA to archaeology?

The context of this quote is Burt Rutan, head of California based, Scaled Composites, a privately funded space exploration design and construction firm, commenting on the current state of technology at NASA’s Crew Exploration Vehicle project. This project is the key to NASA’s moon and mars initiatives as outlined by President Bush’s “Vision for Space Exploration.” As stated by Rutan, the comparison to archaeology follows that:

“They [NASA] are forcing the program to be done with technology that we already know works. They are not creating an environment where it is possible to have a breakthrough … It doesn’t make sense,” Following this, Rutan argued that the NASA program needs to take risks in order to come upon a breakthrough.”

Now, unless Rutan is experienced in the world of Cultural Resource Management (CRM), the comparison is a bit foggy. Perhaps he is saying that NASA is using old stuff, archaeologists like old stuff, therefore NASA is like archaeologists. That interpretation seems a bit weak for a rocket scientist like Rutan.

I would like to think that the comparison is a good bit deeper and quite accurate from my perspective of working in the CRM industry. As with NASA, most of the work I do for a CRM company is funded, in one way or another, by a government agency. Also, as is the case with NASA, funding dictates the degree to which technology and innovation can be brought into a project. So as Rutan said, the perceived risk of loosing money to technology stifles new breakthroughs and in the end, costs more money.

Although I do get to work on some very cool and techy projects, in CRM in general, there is a lack of technological applications. Don’t get me wrong, technology is applied in some very cool ways and by very smart people, but the run of the mill phaseI/II investigation, which a huge portion of projects are, are relatively devoid of technology more recent than the trowel and shovel.

“So what” you say, the trowel and shovel work just fine and get the job done. I agree, but the point is, try and step out of the box and chances are you will be shot down. Whereas archaeology will always need the shovel and trowel, usually as a precursor to a bulldozer and grader, there is a host of technology that can work with the process to make the end product more accessible, accurate, and cheaper.

A creative environment is a hard thing to fund is CRM. The trickle down of process and methodology from the academy is a good, but implementing is in a quick and cost effective way, quickly and cost effectively, can be a challenge. I’m sure NASA faces many of the same hurdles. If this is what Rutan meant, then I whole heartedly agree.

Whereas Rutan said he would not want NASA Chief, Mike Griffin’s job of making President Bush’s space vision work give “only pennies to do it.” As an archaeologist in CRM, I truly enjoy the challenge.

Thursday, May 04, 2006

Site News: The CRMGIS blog is moving: www.gisarch.com

I am ready to make the big move to a new domain, I think?

The new site http://www.gisarch.com is up and running. There are a handful of cosmetic changes to be made, but the content is there. The RSS feed from Feedburner has been moved. If anyone is subscribed via anything but feedburner, please visit the new site and reconnect. Sorry for the inconvenience.

I hope that the new publishing platform, WordPress, will give me more flexibility in layout and content features. Also, I hope having a more relevant domain name will help create an audience.

I will continue to post on both site for the time being. This is for folks who arrive here via established links or bookmarks, as well as, keep up the archives that readers may be linked to.

Feel free to email me ( admin /at/ gisarch /d0t/ com) with any issues about the move or any problems with the new site. I would appreciate it. Thanks!

Mass Mapping the Isle of Wight

This morning, OpenStreetMap was covered on the hugely popular Boing Boing blog. The post, linked to a full story at digital-lifestyles, describes the critical mass like effort of 30+ mapping enthusiasts who plan to map the Isle of Wight off the UK coast. The effort will produce a spectrum of spatial data that will be distributed under the Creative Commons license.

The intention, beyond gathering good data, is to show that is does not take a government entity, e.g. the Ordnance Survey, to bring spatial data to the people. Great project, I can't wait to see the results.

Wednesday, May 03, 2006

Archaeology of a 1945 Prison Escape ... Part 1

The Story of the 1945 Escape Tunnel

On April 3rd, 1945, 12 men escaped from the Eastern State Pennitentary in Philadelphia. Among them, was the notorius bank robber, "Slick" Willie Sutton. Sutton, as well as the tunnels engineer, Clarence Klinedinst were caught very shortly after the escape. Within 2 days, all then men were back in the prison.


On April 1st, 2006, the tunnel was cleary seen again for the first time in 61 years.


Although, I am late to the game, since this story has been covered by ArchaeologyNews, the AP, NPR, and a slew of newspapers and blog, I figured I should tell my side of the story since it was my companies job to find it.

The story goes, prior to the escape, Clarence Klinedinst, being a mason, was tasked with replastering the walls of cell block 7 (SW arm in this live.com view). After completing this task, he bargained with the officials to give him his choice of cells, he chose cell #68. Incarcerated by him self, he began a project that would take him over a year to complete. Beginning with a specially placed thin plaster wall, which he created during his replastering duty, he began his dig to freedom.

Cell #68 is located at the distal end of cell block 7, with nothing but 100ft of courtyard, and a 30 foot wall between it and the outside. Clarence Klinedinst (aka Kliney), began to dig, at first by himself then later with a cell mate, into the wall and straight down to the sand sediment below. Once Kliney was into the wall and through the footer, there were no obstructions until he would encounter the 12 foot deep base of the prison wall.

Digging for close to a year and a half, Kliney and his cell mate alluded suspicion. Taking turns digging at night, one prisoner would sleep while the other dug. Paper Mache heads were constructed to fool the ever watchful guards. At first, the prisoners disposed of the rock and soil in the cell toilet and in the yard. After a number of feet was dug from the tunnel, a brick sewer pipe was encountered and used to discard the dirt.

The tunnel was well planned and equipped with an electrical lighting system and wooden bracing. to help keep its integrity. Heading level across the yard, the tunnel was dug to the base of the outer wall and then dug down ~5 feet to get below the walls footing. At this point, the tunnel was excavated through the water table of an old stream that used to flow across the area, before it received 15 feet of fill to level the prison yard.

This stream was part of the escape undoing. On the morning of April 3rd, Kliney, his cell mate, Slick Willey, and 9 other opportunists made a mad dash through the tunnel and out the tiny exit hole on the corner of 22nd and Fairmount. With clothes wet and muddied from crawling though the water filled depression under the wall, the police had little difficulty following the tracks and capturing the crooks. All were hauled back to jail, and one of America's greatest escape stories was born.

In the second part of this post, I'll go over the technology and archaeology that were used to find the tunnel... stay tuned

Site News: Working on new CRMGIS blog

Soon, I will be moving the "GIS for Archaeology and CRM" to a new home. I have secured a domain (www.gisarch.com) and I am working on configuring WordPress. Hopefully this move will offer a better site with little inconvenience to the readers. I suppose a few issues will need to be ironed out with RSS and such, but it shouldn't be too painful.

I'll be sure to keep you posted...

Monday, May 01, 2006

Bosnian Pyramid: Google Earth Used to Disseminate Data

Photo Credit: http://www.bosnianpyramid.com/

What are the chances of the world’s tallest man-made pyramid being found in Visoko, Bosnia-Herzegovina? Well, according to the data and available studies on the BosnainPyramid site, at least somebody believes it. Although, the intention of this post is not to support or debunk the authenticity of this find, but instead, just to point out an example of a project (albeit off-beat) using Google Earth maps and links, as well as, a blog’ish publication scheme to produce data that can be accessed by many and, in this case, be swept up into a media whirlwind.

(This article from Archaeology Magazine will give the stance that many professionals take on this issue)

A little background on this site tells quite an interesting story. The 2,120 ft peak of Visocica, towering over the small town, has been noted for its four sided geometric shape long before the recent excavations. Stories going back the 14th century describe a hidden subsurface structure that once housed the Bosnian king, Tvrtko of Kotromanic. Much more recent reports include the uncovering of engraved building blocks and other faced stones in the constructions of roads and a foundation.

In comes Semir "Sam" Osmanagic, a Texas businessman with an appetite for the weird and wonderful aspects of “archaeology”. Semir, of Bosnian descent, has believed for 15 years that Visocica is the location of the world’s largest man-made pyramid. Now, with a government supported 5 year excavation and a swell of nationalistic pride in his court, Mr. Osmanagic seeks to prove to the world that he has found what he promised. Brushing aside the pleas and claims to halt excavation, by well established archaeological professionals, Mr. Osmanagic presses on.

The website dedicated to the Bosnian Pyramid Archaeological Park, with a clean 3-column design, provides updated content, stories, relevant research aspects (geology, remote sensing, etc…), and a section of maps and KLM downloads ( Sun Pyramid). Fitting well with the Indiana Jones feel to this project, the Google Earth links quickly transport the viewer to the location of the alleged pyramid. Also, there are links to other “pyramids” and a rubbersheeted topo map that gives a decent indication of the topography. How long before someone places a Google SketchUp model on the spot?

Although the technology is nothing fancy and the presentation is simple, the 595 views of the pyramids GE placemark on the keyhole site is probably more looks, virtual or actual, than most archaeology sites will ever see. Certainly, it is the highly controversial and compelling story that created the media frenzy around this “find”, but the availability of data in the form of flying into and around GE placemarks and raster overlays helps get the point across.
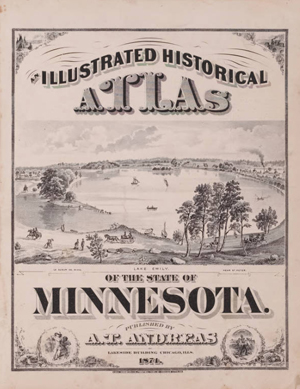
Minnesota Historic Plat Maps Online


Cover this morning at The Map Room blog, the Minnesota Historical Society has scanned and made available a large collection of historic maps ranging from 1848 to 1907. The online collection is drawn from the society’s archive of 19,000 maps and 2000 atlas volumes. The main archive contains map dating back to 1581.

The online version of this amazing catalog contains plat maps and atlases created by the General Land Office and the Bureau for Land Management. The plat collection is searchable by county or township/range. The scanned atlas editions include a statewide coverage, as well as, Dakota, Hennepin, Ramsey, and Winona Counties.

I am not sure how recent the addition of the online map resources is, but I thought it may be useful to the handful of Minnesota readers.

Thursday, April 27, 2006

Google 3D Warehouse: "A 3D interface to the planet"

That is what Google said about the 3D Warehouse and at this point, I believe them.

The 3D warehouse, as described in the post below, it Google/SketchUps new 3D data housing format and model search portal. As described by Google:
"Click here to download the 3D Warehouse network link. With this file Geo-referenced SketchUp models in the 3D Warehouse become available for viewing within Google Earth. Virtual world builders, start modeling!"
Virtual World Builders... Very cool.
In a days work, I was able to take CAD footprints, photos, and a hand drawn archaeology map and produce a georeferenced, downloadable, and sharable models of insitu archaeological structural components (walls) and detailed surrounding standing structures. I hope my boss does not find out how productive I can be when Google does cool things like this.

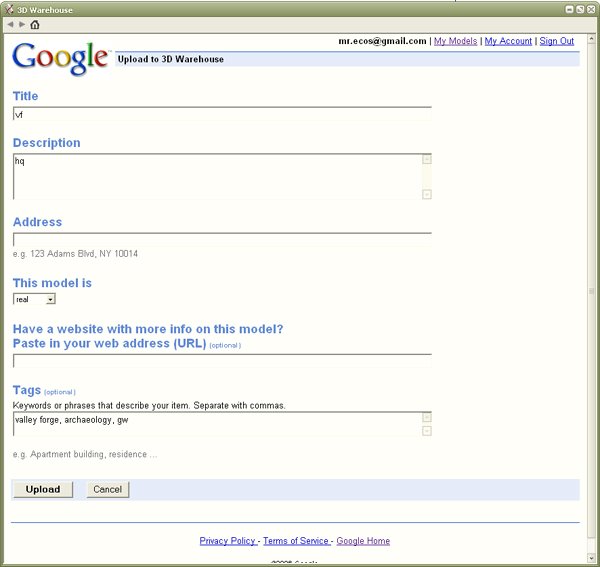
Okay, here is a rundown of the online end of the 3D Warehouse. By clicking the "Share Model" icon, a Google window pops up that ties into your own Google account. (What else did you think you were going to do with those 2 gigs for each of the 10 Gmail accounts you have?). Type in a bunch of info about your model, including the Tags, and the upload begins.
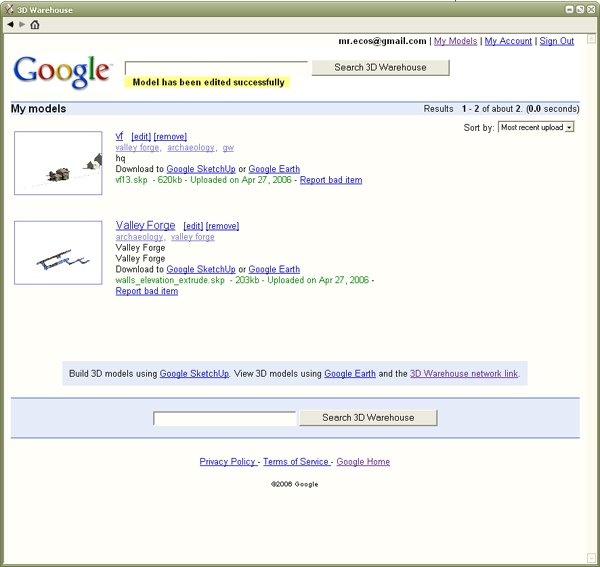
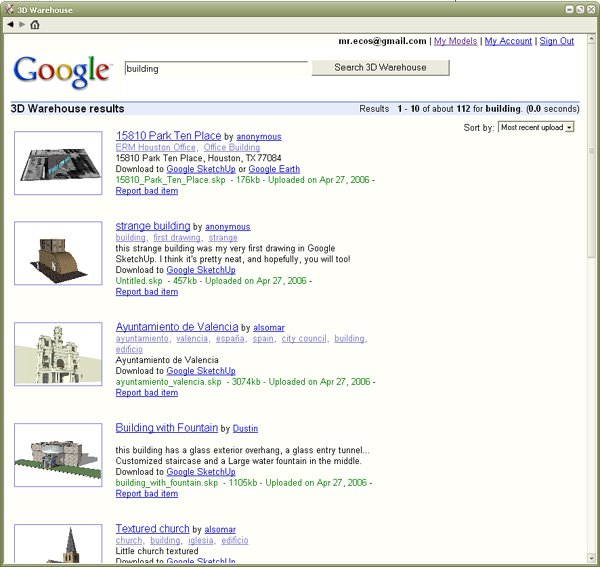
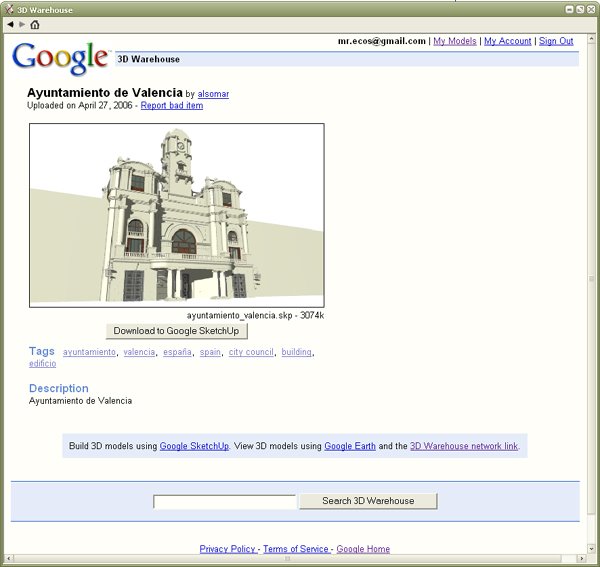
You model is loaded in to your "My Models" page. From here, you can search the tags and filename of others people models. For instance, this is the return from the search for "Building".
When you find a model you like, you can download to either Sketchup or Google Earth. Simple as that.

It seems pretty obvious that Google wants a copy of Google Earth and SketchUp installed onto every able bodied computer. They want to see a legion of modelers "SketchIng" their favorite places, tagging them, and sharing them. Content of the world, built by the world, for the world. (or at least the 20% that have access to computers.)

Google SketchUp is now FREE!!!!


Yup, you heard it correctly, the recently acquired @Last team has worked with Google to produce a free version of their very popular 3D architecture and landscape program, SketchUp. (FREE download Here) As of now, SketchUp is the most commonly used program to create 3D models to be placed in Google Earth.

The free Google SketchUp version is windows only. There is also a Pro version which can be purchased for $495. This is much more like the original and at the original SketchUp price.

SO what are the new features!? Well, the Free version appears to have a similar tool selection as the original without some features like realtime shadow modeling and, most noteably, the ability to export in formates other than the Google 3D warehouse. What? Did you say Google 3D warehouse?

Yes, there is a new Kml housing format called a 3D warehouse. Although my download has not completed yet, I have messed with it a little from a link on the ogle earth blog. Save your models to a 3D warehouse and when put on a server, you point people to a 3D warehouse network link, much like a KMZ. When the link is opened in Google Earth, the Places menu will display the locations of the 3D models. Also, on the virtual globe itself, a icon appears at the location of the model or a icon will appear for an "object collection", a group of models.

The models are not directly downloaded with the 3D warehouse network link. By clicking on a model name/location in the Places menu or clicking on the icon, a popup window will give you details about the model and ask if you would like to download it.
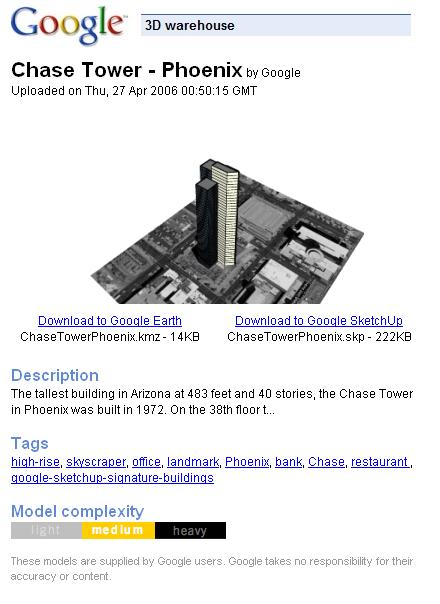

On this popup, details such as model name, size, and complexity are given. Also TAGS!!! Yes, Google has employed tags into the models. Let the Metaverse begin!!!! From here, you may download the model to either Google Earth of Google Sketchup.

At this moment, textures are still not supported in Google Earth. I suspect, as well as many others, that this will change soon.

Here is a list of features the separate the Pro version from the Free version:

Print and export raster images at higher-than-screen resolution.
SketchUp Pencil Icon Access to the following 3D export formats: DWG, DXF, 3DS, OBJ, XSI, VRML and FBX.
SketchUp Pencil Icon Export animations and walkthroughs as MOV (Mac) or AVI (Windows) files.
SketchUp Pencil Icon Use the Sandbox Tools (for organic modeling of terrain, etc) and the Film & Stage Tools (for pre-viz work).
SketchUp Pencil Icon Have access to free email tech support for two years from purchase.

This story has been scooped this morning on a number of other blogs (Cartography, Google Earth Blog, All Points Blog, ogle Earth). Get out there and make some models!!!!

Wednesday, April 26, 2006

USGS Bedrock Geology Maps for Google Earth


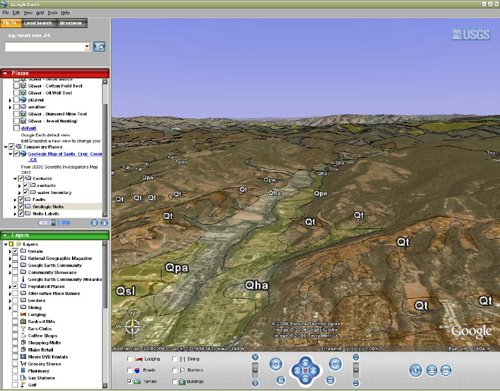
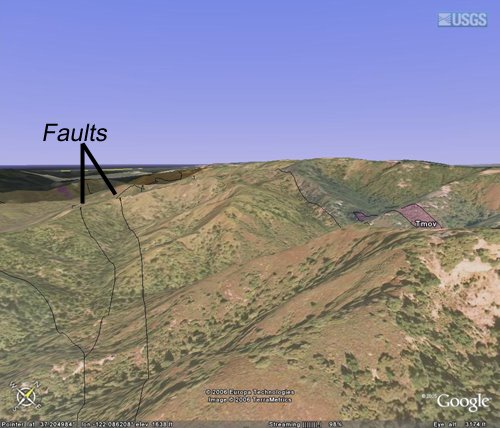
Covered this morning in the Google Earth Blog is the introduction of a series of geologic maps for Northern California in Google Earth KMZ format. Produced and distributed by the United States Geologic Survey (USGS), these maps depict the bedrock geology for 12 counties.


The network link from the USGS includes the geologic units and their abbreviated formation name as a label. Interestingly, the link also includes place markers for faults, in this case all 710 faults in Santa Cruz County, geologic contacts, and water contacts. If course the transparency can be adjusted to merge the geology with the underlying imagery or you can add your own imagery to start some analysis.


Digital bedrock geology maps can sometimes be a pain to find for a study area and unless yours is in North California, this may not help you. But the direction that the USGS is taking here is clear. Data in Google Earth format is very easy to use, free or cheap, readily available, and fun to explore. Given the abilities of Google Earth to add your own imagery and the number of converters that can put GIS and 3D data into Google Earth (KML Home Companion(ArcGIS), Arc2Earth, Maya2GoogleEarth, to name a few) archaeological, Heritage management, and conservation groups should be taking full advantage of this technology. Although the analysis capabilities are simple (ArcGIS Explorer may change this) the data exploration, display, and dissemination aspects are tremendous. With a little bit of conversion and rubber sheeting, specialized information can be deployed to nearly any audience. It seems pretty apparent that with so many people realizing that maps make a fantastic vehicle for all kinds of information, spatial thinking will prevail and the technology will follow.

These maps are in an effort to disseminate geologic information and awareness in light of the 100th anniversary of the 1906 San Francisco Earth Quake.

New RSS feed


After learning that my RSS feed was broken for a long time (thanks Tijl), I implemented a new Feedburner feed. By clicking on the RSS icon on the right hand column, you can add my feed to your favorite aggregator. Alternately, if you are using FireFox/Mozilla, you can click on the same icon in the location bar of your browser and add it as a live bookmark.
To anyone who tried to subscribe before, sorry for the inconvenience.

Monday, April 24, 2006

CAA 2006 - Pictures from Closing Party

Here are some pictures from the closing bash of the CAA 2006.

I know this post is long, sorry for the inconvenience. Click on my Flickr badge (under my links) for a few more CAA pictures.

First time to my blog? Please continue past this post and read on about the excellent papers and topics discussed at the CAA.

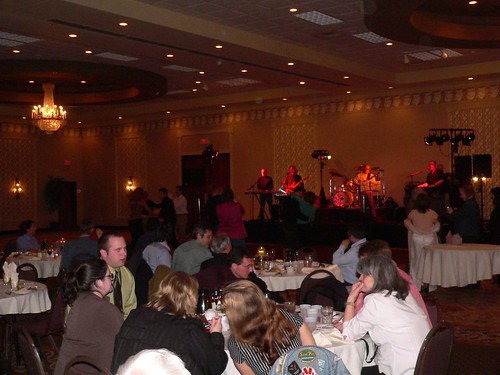
Seated dinner with great band!


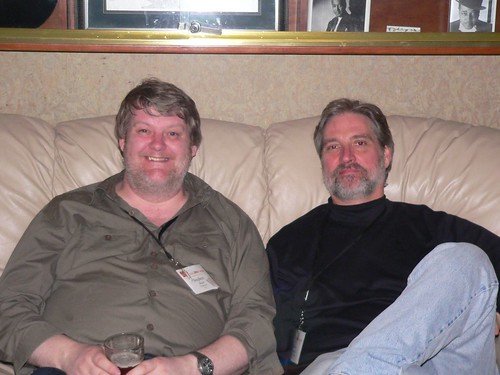
Stephen Stead (CIDOC) and Mark Mudge (CHI)


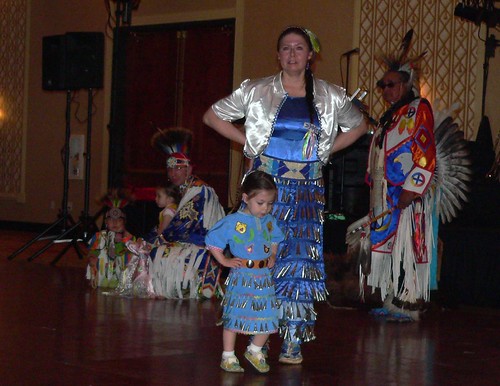
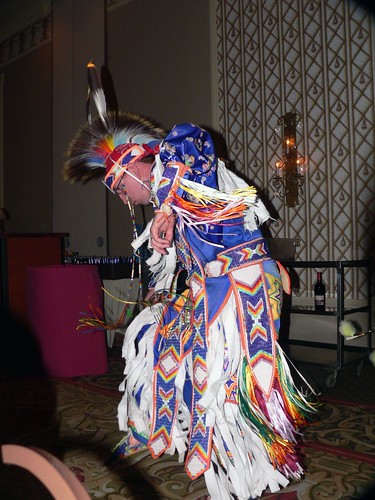
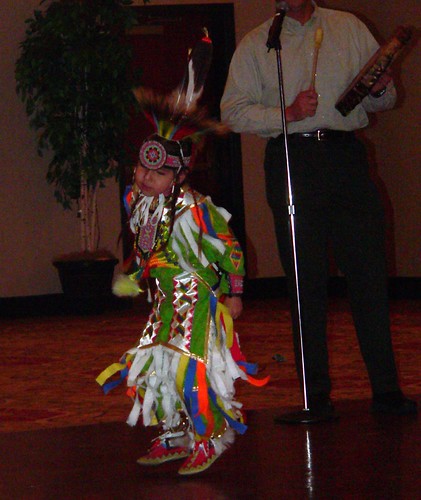
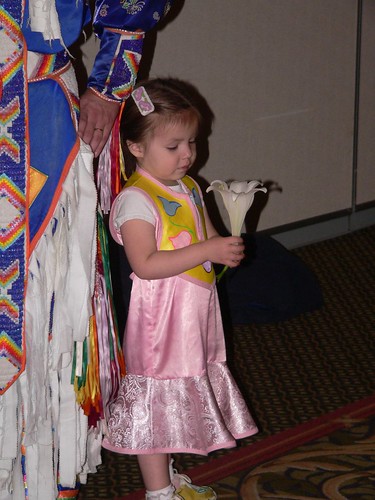
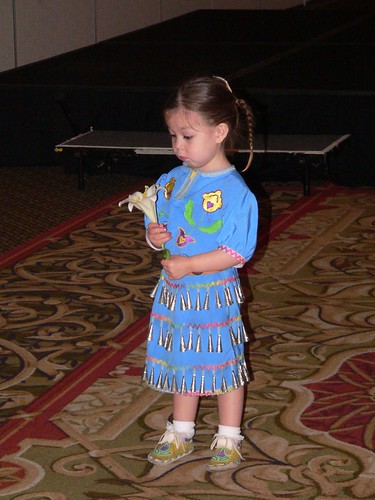
A series of images of the Ojibwa dancers.
I wish I had the names of
these folks. They were fantastic to watch and extremely nice and open to talk to. This was a definite high point for the conference.


The esteemed Dr. Frederick A. Cooper and grad student Melissa Geppert.


and again, this fun filled cast of characters!
Including Tijl Vereenooghe at the far left.


Sunday, April 23, 2006

CAA 2006 - Day 4: Google Earth, Quantitative Methods, 3D Cityscape


Okay, a little late, but here are my notes from CAA Day 4...

On the final day of presentations at the CAA, I drifted around to a variety of sessions and caught a bunch of great papers. Here is a brief summary of the topics I found interesting.

Google Earth for Archaeological Aerial Prospection

Dr. Scott Madry, of the University of North Carolina, was back with another paper demonstrating an applied and successful technique. Based on Madry's extensive history in aerial survey, he decided to make a project out of Google Earth as a tool for remote sensing. Over the past year, there has been a number of stories of successfully using Google Earth to identify archaeology sites, particularly in Europe. Madry's project is now added to this list.

Searching a study area in Burgundy France, which is represented with 1m resolution aerials, Madry set to work. From his office in Chapel Hill, North Carolina, Madry located 3 significant sites within the first thirty minutes. Completely elated, yet surprised with his initial success, he continued through the study area to find a total of 3 major road segments and 101 possible structures represented by circles and squares evident in agricultural fields.

Shortly after his initial remote success, Madry took a trip to the study area with a colleague to field check his results. The field verification proved that through Google Earth, Madry could successfully locate archaeological sites within his study area. The three major sites he initially found turn out to be prerecorded by the local authority, but this only serves as further verification. A large number of additional, unrecorded sites were also discovered. Shortly, I will try to get a few screen shots or KMLs from Dr. Madry to give more detail about his finds.

Quantitative Clustering Method for Pottery Vessel Lots

One of the afternoon sessions was full of a number of interesting papers discussing quantitative approaches to classification. As this holds true with any topic related to typology, this session was full of debate and perhaps a little contention.

One of the great papers in this group was on a project by Angela Labrador of the University of Massachusetts, Amherst. Angela is in the process of devising a technique to automate the extremely laborious task of ceramic attribution and assignment into vessel lots. At the heart of Labrador'’s new tool kit is knowledge discovery methodology that uses Mclust with the free statistics program R to perform a hierarchical clustering analysis on a database of ceramic attributes. This clustering technique also employs Bayesian statistics to help find the optimum clustering level and make the best assignment of the ceramic sherds into the appropriate number of vessel lots.

Labrador'’s intention is to fine-tune her methodology and then create a standalone, open-source application that incorporates a PostgreSQL backend with the Mclust and R routines, all designed in Ruby on Rails. Way cool!

According to Labrador, this application is a product of a larger research agenda to study the influence of typology on our discussion and nomenclature within the archaeology of the Eastern United States. The Lighthouse Cove Site, a Bushkill Phase site in the Hudson Valley of eastern New York, is the basis of her dataset.

Angela has created a site (down on April 23rd) where you can follow the progress of this project.

3D City Modeling from Archaeological Data

In another fantastic project by Tijl Vereenooghe of Katholieke Universiteit Leuven in Belgium, he seeks to bridge the gap from virtual 3D landscape/cityscape construction to archaeologically correct recreations.
Researching the lack of 3D models that accurately portray the less popular domestic areas of well-known archaeological sites, Tijl and his team have developed a way to produce 3D models of entire cities, such as Pompeii and the Mayan city of Xkipche (9km South of Uxmal), based on city plans and socioeconomic maps derived from archaeological excavation. The end result is a model, which can be recreated with adjusted parameters, which displays accurately placed structures built to mimic the interpreted function for that location.

Using a virtual cityscape engine called City Engine System (I do not think this is yet available from the author), Tijl developed a method for substituting archaeological base maps, building footprints, and functional interpretations as the engines inputs. Shape grammars are developed to address how the facades of buildings with different functions should look. The output data from the City Engine System can then be modeled in many of the high-end 3D packages. For this study, Tijl used Maya to produce his results.

Stills and an animated walk through of the Pompeii and Xkipche reconstructions show that Tijl’s methodology is in very good order. The reconstructions looked better than most virtual attempts and serve as a research tool since they are based on archaeological data and can be created in a series of permutations based on adjusting parameter inputs.

Future considerations are the modeling of building interiors, the application of scanned facade maps, avatar populations, and ultimately the ability to produce models from geophysical data.


The last day of the CAA did notdisappointt! The quality of papers was astounding. As with the past posts of the CAA, I apologize for any errors or misconceptions I have published about these papers. If the author of the paper or any other reader pick up on my mistakes, please let me know so that I can correct them. My intention is to reflect the author's intent.


Saturday, April 22, 2006

CAA 2006 - Day 4 and Closing Banquet

Well, the CAA is now over, but the effects are still lingering. Although, I have a bunch of notes from some great papers on Day 4 (Friday), I will not get to them until tomorrow.


Honestly, the closing banquet and fun that followed has put me out of commission. Between the great conversation, great food, great entertainment, and most of all, great people, the CAA 2006 in Fargo ended with a bang! Too bad my head, after a days worth of bumpy air travel, is still reminding me of the fun.

I have a few stories and a bunch of pictures from last evening to share. As soon as I get my sense back, I will have them on the blog.


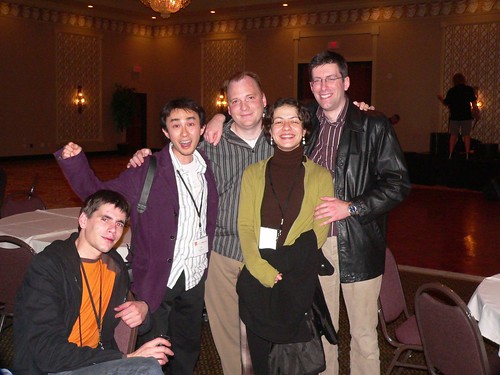
Photo (taken by myself) of a few of the great people
who stuck it out with me until the end.

Friday, April 21, 2006

CAA 2006 - Day 3 Addendum: ArchaeoML and Tagging


I couldn't quite get all this written last night, so here is a brief of the Day 3 afternoon session I attended...

XML and Tagging
The afternoon session on Database management was chaired by database rock star, Edward A. Fox. Ed Fox is gaining quite a fan club here in Fargo, well, there is at least two of us. If you ever need a real-deal session chair, he's the man!

Back to the session, Tyler Bell, Oxford ArchDigital opened his paper with why XML is like Sex: Everyone thinks they are great at it, Everyone is doing it, everyone is talking about it, but not everyone is as doing what they think they are. This informative talked, in a point counter-point format, followed with what it is to actually "use" XML and why to "use" XML. Although there were no specific applications, Tyler pointed to a number of possibilities and prudent uses for XML in cultural heritage.

Building upon Tyler's XML info, the session turned to a paper by Eric Kansa, delivered by David Schloen. Eric has developed the Open Context project as "an Internet-based archive that aims to preserve and promote our shared, global heritage." Open Context is, in short, a searchable and taggable archive of user provided cultural heritage content. The key to this project is the development of a folksonomy based on the tags provided by the community. Yes, this is the application of "web 2.0" ideas to cultural heritage management! The discussion that followed this paper was quit lively and full of great ideas.

Is a folksonomy the answer to creating a universal language within an discipline that has as many languages as practitioners? Some in the audience agreed that it is a fantastic way to organize data, while others like to view it from the point of adding value and data relationships where specialist have never seen them. The ideas of democratize data and building an archaeological thesaurus based on community tagging was explored. Of course, there are technical problems with relying on tagging as the main system of data description and cross-project mapping. Interestingly, David Schloen, who presented the Open Context paper on Eric's behalf, is involved with a similar project, OCHRE (Online Cultural Heritage Research Environment) at the University of Chicago.

OCHRE is a XML structured schema, called ArchaeoML, with a java web frontend. The general idea between Open Context and OCHRE seems similar, but the underlying data structure is quite different. As I understand it, OCHREs use of ArchaeoML creates a data structure and mapping capability that is much more robust than community tagging alone. The ArchaeoML structure of OCHRE also carries the capability for community tagging and relationship identification. So although, the OCHRE project has many more standards, it still has all the abilities to build a folksonomy based thesaurus and retains the research grade data structure in the XML schema. I hope I did not butcher those descriptions too bad.

Is the internet and/or archaeological community ready for multi-vocal community interpretation and Cultural Heritage with user added value? I think so. It seems that many others feel the same way. How structured should the common vocabulary be? The OCHRE and CIDOC CRM (Stephen Stead, Paveprime Ltd. UK) projects have gone a long way in creating a usable structure that is flexible enough to map varying data sources, but there was also a backing voice to the idea of letting the community develop the language via tagging. I hope that these discussions continue to expand the possibilities for not only how archaeologists interact, manage, archive, and research, but also how the non-specialist public can learn, interpret, and most interesting to me, teach us about the world's cultural heritage.